
Welcome to another Logistics News Update.
This week’s update shows that the logistics environment is still active but not yet predictable enough to run on assumptions.
The concern is that the pressure inside the system remains very real, Durban Gateway Terminal is the clearest example. Cargo is moving through the terminal but vessel waiting times, berth delays, system changes, and landside pressure show that higher throughput does not automatically mean better reliability. Freight News reported average anchorage delays of 80 hours during July, and the latest BUSA / SAAFF update shows DGT anchorage time deteriorating further to 166 hours, with berth time increasing to 116 hours, this is why Durban remains the main port watch point this week.
The message this week is simple, logistics is moving but it is not yet stable enough to manage from averages. A vessel may be scheduled, a border may be open, and a rate may be available, but the shipment is only under control once the terminal position, carrier release, documents, routing, transport, and final landed cost have all been confirmed.
For importers and exporters, the practical discipline remains the same: check earlier, communicate sooner, and build flexibility into routing, documentation, and cost decisions before committing to delivery dates or customer pricing.
Agri & Transport Summary
South Africa’s citrus season remains the main agricultural logistics story as export volumes move through the peak period. Earlier industry estimates pointed to 210 million to 215 million 15 kg cartons for the 2026 season which would be above the 203.4 million cartons packed in 2025. That creates a strong export opportunity, but it also increases pressure on the logistics chain. The main risk is execution, citrus must move from farms and packhouses into cold stores, onto trucks, through ports and onto vessels within tight timing windows. Large volumes remain heavily road dependent and the sector has already warned that traditional trucking models are becoming harder to sustain as citrus volumes grow across the main export corridors.
Durban remains important for citrus movement and the current port pressure makes planning more sensitive. Where fruit depends on road transport, cold chain handovers and vessel cut offs, a delay at any point can create additional storage, truck standing time, missed loading windows and quality risk. Rail reform remains part of the longer-term solution, but it does not solve the current season. The citrus industry has again called for faster rail reform because road-based export movement is carrying too much of the load. Until practical rail capacity is available, exporters must plan this season around road execution, port timing, and cold chain control.
The cost risk is material, Freight News has reported that South Africa’s cold chain has capacity to support growing export volumes, but logistics challenges still put pressure on the efficient movement of perishable cargo. That means the issue is not only whether there is enough fruit or enough demand. The real commercial test is whether the shipment can move reliably at a cost that protects the exporter’s margin.
What to monitor: Citrus peak movement, cold chain timing, truck availability into Durban, port gate performance, vessel cut offs and whether rail reform starts creating practical alternatives for future export seasons.
Logistics & Trade Headlines
- Cargo diversion could ease Cape Town port pressure
Freight News reports that diverting 10% to 20% of cargo through alternative ports before congestion builds could help reduce pressure at Cape Town. For exporters, the point is practical: route flexibility must be considered before cargo is already delayed at port. - Durban delays remain a watch point
Freight News is carrying a current story that Durban vessel queues have returned despite stronger container volumes. This matters because higher throughput does not automatically mean better execution if vessel waiting time, berth availability and landside flow remain under pressure. - Drewry WCI rebounds after three weeks of decline
Drewry’s World Container Index increased by 1% to US$4 297 per 40ft container on 6 August after three consecutive weekly declines. The increase was supported by higher Transpacific pricing while capacity discipline remains part of carrier strategy. - Blank sailings remain part of capacity management
Drewry’s Cancelled Sailings Tracker says container freight rates regained momentum in early August as carriers continued using capacity discipline to support the market. Importers should therefore not rely only on the headline rate because space and routing can still change. - Middle East risk still affects shipping confidence
Drewry’s Intra Asia Container Index strengthened by 1% to US$970 per 40ft and Drewry linked the move to ongoing Middle East conflict. This supports the wider point that geopolitical risk can still influence carrier behaviour, capacity, and pricing even when the cargo is not moving directly through the affected area. - Air cargo peak season is showing softer signals
Freight News is carrying a current update that the peak season slowdown points to a softer air cargo market. For clients, this could affect urgency decisions because airfreight demand and pricing may move differently from ocean freight. - Cape Town port development remains commercially important
Cape Town remains a key export gateway and Freight News reported this week on cargo diversion as a way to ease port pressure. This reinforces the wider issue from last week: port planning, routing options, and early decisions matter more than reacting once cargo is already stuck.
What to monitor: Cape Town diversion options, Durban vessel queues, Drewry’s next WCI movement, carrier blank sailings, Middle East routing risk and whether softer air cargo demand creates any short-term pricing or capacity opportunities.
Let’s Learn, what is a Port Community System and why does it matter?
A blank sailing is when a shipping line cancels a scheduled vessel sailing or removes a planned port call. In simple terms, the vessel does not sail as originally advertised or it does not call at the port where cargo was expected to load or discharge.
This matters because importers often look only at the freight rate. The bigger issue is whether the cargo can actually move on the sailing that was planned. A lower rate is not helpful if the sailing is cancelled, the container is rolled or the next available vessel only departs later.
In practical terms
Shipping lines use blank sailings to manage capacity, protect rate levels, and respond to weaker demand, congestion, port delays, weather disruption, or network changes. Drewry’s Cancelled Sailings Tracker reported 57 blank sailings across the major East West trades from week 31 to week 35 out of 726 planned sailings. That shows why availability still needs to be checked even when headline rates are easing.
For South African importers and exporters, the effect can be practical and costly. If a sailing is cancelled or the port call changes, cargo may miss a delivery window, storage can increase, production planning can be affected, and the landed cost may no longer match the original estimate.
Where businesses get caught
- Accepting a freight rate without confirming the actual sailing
- Assuming vessel space is available because a schedule is published
- Not checking whether the cargo is at risk of being rolled
- Approving landed costs before confirming surcharges and validity
- Promising delivery dates before the carrier booking is firm
- Not allowing contingency where routing or transhipment is involved
Quick example: An importer accepts a competitive rate from Shanghai to Durban and gives the customer a delivery estimate based on the published vessel schedule. Before the container is loaded, the carrier cancels that sailing or changes the rotation. The cargo moves on the next available vessel but arrives later than planned.
The freight rate may still look attractive, but the business can now face delayed delivery, changed cash flow timing, possible storage, additional communication pressure, and customer dissatisfaction.
Takeaway: A lower freight rate does not automatically mean a lower logistics risk. Before confirming delivery dates or landed costs, check the sailing, carrier space, routing, blank sailing risk, validity period and whether the cargo can realistically move when planned.every party is ready
• System information is available, but nobody takes responsibility for acting on it
Quick example
An imported container arrives at the port, but several steps are still required before it can leave the terminal. Customs must release the cargo, the shipping line must issue its release, terminal charges may need to be settled, and the transporter must have the correct documentation and gate booking. Without an integrated system, these updates may be communicated separately by email, telephone or through different portals. A delay or error at one point can prevent collection and lead to additional storage, truck standing time, or demurrage. A Port Community System can allow the relevant parties to see the status of these processes through one connected platform. This does not guarantee that the container will move without delay, but it can make the cause of the delay easier to identify and resolve.
What importers and exporters should check
Before using a port or corridor supported by a Port Community System, confirm:
• Which stakeholders are connected to the system
• Which documents and approvals can be processed electronically
• Whether the system provides live status information or only document submission
• Who remains responsible for monitoring each stage
• Whether transport appointments and terminal access are included
• What contingency process applies when the system is unavailable
• Whether users require registration, training, or separate access permissions
Takeaway: A Port Community System can improve visibility and coordination, but technology alone does not remove port delays. The value depends on reliable information, participation by all major stakeholders and clear responsibility for acting when a problem appears. The strongest logistics process combines digital visibility with active shipment management. Knowing where the cargo is matters but knowing what must happen next is what keeps it moving.
NEWS
Durban Gateway vessels face 80 hour anchorage delays
Freight News
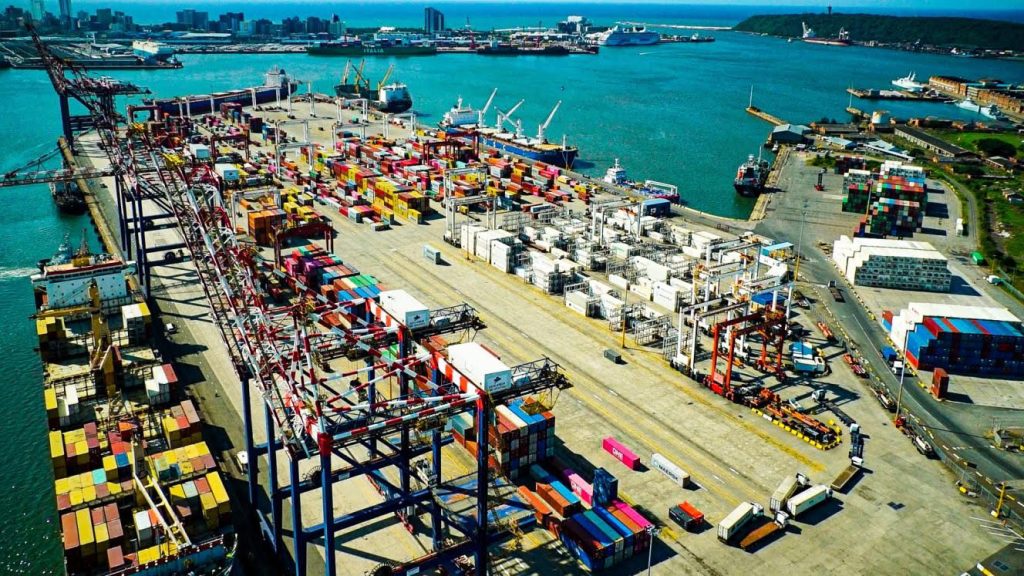
Congestion intensified at Durban Gateway Terminal during July, with vessel anchorage times averaging 80 hours as
port operations came under pressure. Source: Arrive Alive from FreightNews
Congestion at Durban Gateway Terminal intensified during July, with vessels facing average anchorage times of 80 hours as Durban port operations came under pressure. Freight News reported that average berthing time at DGT reached 106 hours, compared with 64 hours at Pier 1, while Pier 1 vessels spent an average 65 hours at anchor.
The concern is that DGT started July strongly but deteriorated towards the end of the month, with estimated throughput reportedly falling by 24% in the latter part of July. SAAFF also noted that actual DGT throughput data was not available and that its terminal reporting was therefore based on estimates. That point matters because it means cargo owners need to work from live vessel, terminal, and carrier updates rather than relying only on weekly averages.
The pressure was not limited to one terminal. Freight News reported that 28 vessels were at anchor across Durban on 31 July, across different cargo types. This places pressure on marine resources such as tugs, pilots, and crews because they must be shared across different vessels and commodity operations.
The commercial issue for importers and exporters is straightforward. When anchorage and berthing delays increase, the effect moves through the full chain. Container availability may shift, delivery dates become less reliable, transport bookings may need to be adjusted, and clients can face additional storage, demurrage, truck standing time, and customer pressure.
Landside pressure also remains a concern. Freight News reported bottlenecks at terminal gates and surrounding roads, with Pier 1 truck turnaround and staging performance deteriorating towards the end of July. This means even once a vessel works, cargo owners still need to confirm stack status, carrier release, terminal access, and transport availability before promising final delivery.
What to monitor: Durban vessel queues, DGT recovery, berth planning, stack status, carrier release, truck booking performance, staging times and whether marine resource pressure affects vessel working across the wider port.
Source: Adapted from Freight News
Port Operations Update:
Durban 5 days
Cape Town 2 days
Coega 1 day
Port Elizabeth 1 day
South African port conditions remain uneven this week, with Durban still the main operational watch point. Current GoComet indicators show Durban at approximately 5 days, Cape Town at approximately 2 days, Coega at approximately 1 day and Port Elizabeth at approximately 1 day. These are general congestion indicators and should not be treated as guaranteed waiting times for every vessel or container.
- Durban: Durban remains the key risk area. Freight News reported that vessels calling at Durban Gateway Terminal faced average anchorage times of 80 hours during July, with average berthing time at DGT reaching 106 hours. The report also noted that DGT performance deteriorated towards the end of July and that wider Durban congestion was visible, with 28 vessels at anchor on 31 July across different commodity types. Cargo owners should confirm vessel arrival, berth planning, stack status, carrier release, truck bookings, and terminal access before committing delivery dates.
- Cape Town: Cape Town is currently showing an estimated delay of approximately 2 days. This is more manageable than Durban, but Cape Town remains exposed to weather disruption, wind delays and cold chain timing pressure. Exporters should continue checking terminal status, vessel cut offs, cold store timing, and transport availability before moving cargo to port.
- Coega / Ngqura: Coega is currently showing an estimated delay of approximately 1 day. This suggests a more manageable position at port level, but cargo owners should still confirm vessel berthing updates, carrier schedules, and stack timing before arranging transport or customer commitments.
- Port Elizabeth: Port Elizabeth is currently showing an estimated delay of approximately 1 day. The general congestion indicator appears manageable, but carrier schedules, transhipment arrangements and vessel specific updates should still be checked before relying on planned dates.
The practical message this week is that Durban remains the main port risk even though the current GoComet indicator is 5 days, not 7 days. DGT’s July performance still shows why averages must be treated carefully. A port can show a better general indicator while specific vessels, terminals, stacks, or landside movements still create delays and additional cost.
What to monitor: Durban Gateway Terminal recovery, Durban vessel queues, berth planning, marine resources, stack status, carrier release, truck booking performance, Cape Town weather exposure and any vessel specific changes affecting cold chain or time sensitive cargo. Source: Adapted from GoComet South Africa Port Congestion Data, checked 10 August 2026.

Key Highlights from Last Week’s Discussions – 02 August 2026
Source: BUSA, SAAFF, and global logistics data
Port Operations
South African container terminals handled 84 798 TEUs during the week of 27 July to 2 August, an increase of 1% from the previous week’s 84 070 TEUs. The daily average was 12 114 TEUs, with 12 943 TEUs projected for the following week.
Performance was mixed across the terminals. Durban Gateway Terminal handled 32 222 TEUs, down 4% week on week, while Pier 1 handled 14 984 TEUs, up 2%. Cape Town Container Terminal declined by 14% to 11 451 TEUs, mainly affected by weather and weaker waterside performance. Ngqura improved strongly, increasing by 20% to 15 472 TEUs, while Port Elizabeth declined sharply by 44% to 2 638 TEUs.
Durban remained the key concern. Although Durban waterside volumes increased across the container handling terminals, Durban Gateway Terminal continued to experience congestion, including disruption linked to a Navis system upgrade and worsening waterside delays. DGT vessels spent an estimated average of 166 hours at anchorage, up from 80 hours the previous week and time at berth increased to 116 hours, up from 109 hours.
Key Insight: Overall container volumes improved slightly but the improvement was not evenly spread. Durban Gateway Terminal remains the main operational watch point because higher volumes are still being matched by serious vessel turnaround and landside congestion pressure.g and delivery risk.
Air Cargo
International air cargo through OR Tambo remained relatively stable, with total volumes of 6 486 tonnes, down 1% week on week. Inbound cargo was 4 070 tonnes, down 1%, while outbound cargo was 2 416 tonnes, also down 1%.
Despite the slight weekly decrease, OR Tambo volumes remain around 9% above July 2025 and 9% above July 2019 levels. Fuel stock levels were reported at 5 days for OR Tambo, 4.7 days for Cape Town International and 10 days for Durban.
Key Insight: Air cargo softened slightly but remains above both last year and pre-pandemic July levels. The market is stable enough to move cargo, but fuel stock and air cargo infrastructure remain important to monitor.
Road and Border Crossings
Lebombo traffic increased during the week, with truck volumes rising to 1 614 heavy goods vehicles per day, up 7% week on week. Queue times remained mostly stable at approximately 4.5 hours, down 2%, while processing times were also stable at approximately 4.3 hours, down 2%.
The wider SADC border picture weakened. Average cross-border queue time increased to approximately 8 hours, up by 1.1 hours from the previous week. Average transit time increased to approximately 7.6 hours, up by 0.9 hours. South African border crossing times increased to approximately 10.8 hours, up 16%, while the greater SADC region averaged approximately 7.2 hours, up 11%.
The total indirect cross-border delay cost increased to an estimated US$44.2 million, or approximately R740 million, up 16% from the previous report.
Key Insight: Lebombo remained fairly stable despite higher truck volumes but the wider regional border picture deteriorated. Beitbridge, Chirundu and Kasumbalesa remained the main pressure points, with Kasumbalesa taking around four days to cross from the Zambian side.
Ocean Freight and Global Shipping
Global shipping conditions remained volatile. Drewry’s World Container Index increased by 1% to US$4 297 per 40ft container, following several weeks of rate declines. The Shanghai Containerised Freight Index also rebounded by 4.7%, supported by Asian demand, congestion, and equipment shortages.
Fewer than 300 containerships remain diverted around the Cape, representing approximately 4.1 million TEUs or 5.2% of the global fleet. This is lower than the earlier 2026 peak, but network reliability remains uneven, especially on South American, African, and Middle Eastern trades.
Charter rates remain elevated, with the Harper Petersen Index at 2 343 points.
Key Insight: Freight rates are no longer falling cleanly. The market remains sensitive to congestion, capacity discipline, equipment shortages, and geopolitical risk, which means importers should continue checking freight validity, routing, surcharges, and space before finalising landed costs.
Global Air Cargo
Global air cargo demand softened in late July, with worldwide chargeable weight down 3% week on week. The decline was led by Africa, down 7% and Asia Pacific, down 5%. Europe and the Middle East and South Asia each declined by 2%.
Worldwide capacity decreased by 1%, while the global average rate stabilised at US$3.02 per kilogram, supported by rising jet fuel costs and fuel surcharges.
Key Insight: Global air cargo volumes softened but pricing did not fall meaningfully because fuel costs supported rates. This means airfreight remains useful for urgent cargo but should still be costed carefully.
Strategic Outlook
The latest BUSA / SAAFF update shows a logistics environment that remains active but uneven. Port volumes improved overall, air cargo was broadly stable and Lebombo handled higher truck volumes without a major increase in queue time. However, Durban Gateway Terminal remains under pressure, wider SADC border times worsened, and global freight rates started edging upward again.
The practical message is that cargo owners should not rely on national averages alone. Each shipment still needs to be checked against the specific terminal, carrier, vessel, route, border post, document requirement and landed cost before delivery dates or customer pricing are confirmed.
What to monitor: Durban Gateway Terminal congestion, Navis system recovery, vessel anchorage and berth times, SADC border delays, Kasumbalesa crossing times, Drewry’s next WCI movement, global air cargo rates and whether Suez diversions continue easing.
Global Freight Rates
Drewry’s latest World Container Index rebounded by 1% to US$4 297 per 40ft container on 6 August 2026, after three consecutive weeks of decline. Drewry says the increase was mainly supported by higher Transpacific rates, with Shanghai to New York up 4% to US$7 893 per 40ft and Shanghai to Los Angeles up 3% to US$5 894 per 40ft. This is a change from last week’s easing trend. The index is no longer falling cleanly, and the market remains sensitive to carrier capacity decisions, port congestion, and geopolitical risk. BUSA / SAAFF’s latest Cargo Movement Update also confirms the same Drewry figure of US$4 297 per 40ft, noting that rates edged up after several weeks of decline.
On the Asia to Europe trade, Drewry reported a more stable picture. Shanghai to Genoa declined 2% to US$5 506 per 40ft, while Shanghai to Rotterdam held steady at US$4 653 per 40ft. Drewry also noted that three blank sailings were recorded this week on Asia to Europe and the same number is scheduled for next week, which shows that carriers are still managing available capacity. Global shipping conditions remain volatile. Drewry notes that the East West market is still being affected by Middle East tensions, new US tariffs, and congestion at Asian ports. Several carriers have also introduced Emergency Fuel Surcharges from August because of renewed uncertainty around the Strait of Hormuz.
For South African importers, the practical message is that a lower rate trend cannot be assumed. Drewry does not measure South Africa directly, but global rate direction still affects Asia origin pricing, carrier behaviour, blank sailings, equipment availability, surcharge exposure, and routing decisions. Freight validity, vessel space, routing, free time, and all surcharges should be reconfirmed before finalising landed costs.
What to monitor: Drewry’s next WCI movement, Transpacific rate strength, Asia to Europe stability, blank sailings, Emergency Fuel Surcharges, Middle East routing risk, Asian port congestion and whether carriers continue using capacity discipline to support rates. Source: Drewrey World

Final Thoughts
This week’s update is a reminder that volume alone does not tell the full story. South African container throughput improved slightly, air cargo remained broadly stable and global trade continues to show resilience, but the pressure points inside the system are still very real.
The main lesson is that the risk has moved deeper into the execution chain. Durban Gateway Terminal is moving cargo but vessel waiting times, berth delays, system changes, and landside pressure show that throughput does not automatically translate into reliability. The same applies across the wider network. A border may be open, a vessel may be scheduled, and a rate may be available, but the shipment is only under control when the terminal, documents, release, transport, and final cost have all been confirmed.
For importers and exporters, this is the difference between planning and reacting. The businesses that manage this market well will not be the ones that follow only the headline numbers. They will be the ones that check earlier, communicate sooner, and build flexibility into their routing, documentation, and cost decisions.
The practical message is simple. Logistics is still moving but it is not yet predictable enough to run on assumptions. Every shipment needs to be managed on its own facts, from booking to delivery.
Operational: Confirm the real position of the vessel, terminal, stack, carrier release, and transport before promising delivery.
Legal and regulatory: Treat customs, border, and advance cargo requirements as part of shipment planning, not as paperwork to be sorted out later.
Market and cost: Do not assume rates will keep easing. Recheck validity, surcharges, routing, capacity, and final landed cost before committing to customer pricing.
Disclaimer:The information provided in this newsletter is based on reliable sources and has been carefully verified. This Logistics News is distributed free of charge. If you wish to unsubscribe from our mailing list, please reply to this email with “unsubscribe” in the subject line. Please note that all content is adapted or directly quoted from its original sources. We take no responsibility for any inaccurate reporting; we are only adapting the news for you.
This week’s news was brought to you by:
FNB First Trade™ 360 — your partner in logistics and Exporters Western Cape