
Welcome to another Logistics News Update.
Last week we noted that there is a problem at Durban Gateway Terminal (DGT) that is run by the international outfit International Container Terminal Services, Inc., usually called ICTSI. Well things have spiralled to the point where they have brough this to the attention of The Office of the President. So, it goes without saying that this week’s logistics update is centred on DGT, where operational disruption has moved from a terminal concern into a national supply chain issue. The transition to DGT’s independent NAVIS N4 system has been followed by wider pressure across bookings, yard flow, stack accuracy, equipment availability, landside evacuation, and terminal coordination. SAAFF has now formally declared the situation an operational crisis and that is the reason they escalated the matter, with a delegation visiting the port on 21 August after industry warned that container flows had become severely constrained.
The issue for cargo owners is not only that containers are delayed but also that the delay risk is moving through the full chain. When terminal fluidity breaks down, the impact quickly reaches vessel planning, truck bookings, container release, rail movement, delivery commitments, and final landed cost. Engineering News reported that stack occupancy was nearing 85%, which leaves limited operating space inside the terminal and makes it harder to move containers efficiently between the vessel, stack, road, and rail interfaces.
The cost concern is becoming just as important as the operational concern. SAAFF has argued that costs caused by system and operational delays beyond the control of cargo owners, freight forwarders and transporters should not simply be transferred downstream through avoidable storage, demurrage, detention, and truck standing time. The association has also proposed recovery measures covering booking capacity, container evacuation, stack fluidity and accuracy, equipment availability, rail integration, and the use of alternative capacity elsewhere in the port system where practical.
There is also positive news from the agricultural sector, South African citrus exporters have made progress towards improved access to India after additional fruit fly cold treatment options were approved. This should provide greater logistical flexibility and may improve fruit quality on arrival. India remains a relatively small market for South African citrus, but the Citrus Growers’ Association sees significant long-term potential, especially if future trade negotiations reduce the current tariff disadvantage.
The practical position this week is clear, Durban cargo needs active management from both an operational and commercial side. Before making a delivery commitment, confirm the actual vessel position, terminal status, stack availability, release position, free days, transporter booking and whether any additional storage or delay costs are developing. For international shipments, the same discipline should be applied to the current freight rate, surcharge position, space allocation, and sailing date.
Agri & Transport Summary
Improved India access creates a longer-term opportunity for South African citrus: South African citrus has made further progress towards improving access to the Indian market after India approved additional fruit fly cold treatment options for fresh citrus exports from South Africa. The approval followed completion of the World Trade Organisation notification process in late July, and the Citrus Growers’ Association says the additional treatment options should improve fruit quality in the destination market while giving exporters greater logistical flexibility. India currently represents a relatively small share of South African citrus exports, but the potential market is substantial. CGA points to India’s population of almost 1.5 billion people, its growing middle class and continued economic growth as reasons the market could become increasingly important for South African growers. The industry began promoting South African citrus in India during 2025 and CGA says volumes grew approximately 85% from a low base following that initial investment.
There has also been progress on the trade side. India and the Southern African Customs Union have signed terms of reference to begin negotiations towards a proposed Preferential Trade Agreement. CGA would like these negotiations expedited because South African citrus currently faces tariffs of approximately 25% to 30% in India which puts local fruit at a disadvantage against competing origins that benefit from preferential tariff arrangements. The logistics importance is that improved cold treatment flexibility can make the trade more commercially practical before any tariff change takes place. Cold treatment requirements influence routing, equipment, transit time and fruit condition on arrival, so additional approved treatment options provide exporters with greater flexibility when planning shipments into a market where quality and landed cost will determine whether growth can be sustained.
The opportunity is therefore longer term rather than a major change to the current citrus season. If market access continues improving and tariffs eventually become more competitive, India could provide another destination for South African fruit and support the wider objective of diversifying export markets.
What to monitor: India citrus export volumes, use of the newly approved cold treatment options, fruit quality on arrival, carrier routing into India, tariff negotiations between India and SACU, competitor origins with preferential access and whether India becomes a more meaningful destination for South African citrus over the next few seasons.
Logistics & Trade Headlines
- Durban Gateway Terminal declared an operational crisis: SAAFF has escalated the situation at Durban Gateway Terminal to the Presidency, with Engineering News reporting that the matter was elevated as an “operational crisis” and that a Presidency delegation was deployed to investigate the issues at the Port of Durban. The practical point for clients is that this is no longer only a system-change problem, it is now a supply chain recovery issue affecting terminal fluidity, container flow, landside movement, and cost exposure.
- Durban backlog grows after NAVIS system upgrade: Freight News reported that a backlog developed after the DGT operating-system upgrade disrupted landside operations, with the terminal handling 25 793 TEUs between 10 and 16 August, down 26% week on week and reaching only 66% of target. By 19 August, 10 container vessels were waiting outside Durban, seven for DGT, two for Pier 1 and one for Point.
- Maersk waiting times show the commercial risk at Durban: Freight News reported that Maersk vessel waiting times were between eight and 12 days, while DGT vessels spent an average of 66 hours at anchorage and 70 hours at berth during the reporting week. For importers and exporters, this directly affects delivery planning, truck bookings, container release, storage exposure, demurrage risk, and client commitments.
- Drewry WCI rises for a third consecutive week: Drewry’s World Container Index increased 4% to US$4 526 per 40ft container on 20 August, driven by higher Transpacific rates. This is the third weekly increase in the recent rebound and confirms that global freight pricing is not easing in a straight line. Importers should continue checking validity, surcharges, space, and routing before approving landed costs.
- Blank sailings remain active despite returning capacity: Drewry’s Cancelled Sailings Tracker shows 49 blank sailings expected from week 35 to week 39, covering 24 August to 27 September, equal to a 6% cancellation rate across major East West trades. Drewry says cancellations are concentrated on the Transpacific eastbound trade, followed by Asia to North Europe / Mediterranean and the Transatlantic.
- Intra-Asia rates move higher again: Drewry’s latest tracker shows the Intra-Asia Container Index rising 6% to US$1 091 per 40ft container on 20 August. This matters for South African importers because congestion, feeder disruption, equipment positioning and schedule reliability at Asia origin can affect cargo before it connects onto the South Africa trade.
- Ressano Garcia border upgrade gets underway: Freight News reported that Mozambique has broken ground on a 980-million-metical, approximately R260 million, modernisation of the Ressano Garcia border post. The project includes the KM4 road-freight terminal, access roads, express lanes for mineral trucks and freight infrastructure intended to improve truck flow on the Maputo Corridor.
- SARS digital platform maintenance affects customs platforms: SARS scheduled digital platform maintenance for 22 August, warning of possible intermittent service interruptions on eFiling, Tax and Customs Digital Platforms. For traders, this is a reminder that customs platform availability must be factored into document timing, especially where urgent release, amendment or declaration work is required.
What to monitor:
Durban Gateway Terminal recovery, Presidency and SAAFF intervention updates, transporter response to DGT delays, vessel waiting times at Durban, stack, and booking fluidity, Drewry’s next WCI movement, blank sailing exposure, Asia origin congestion, Ressano Garcia border works and any customs platform interruptions affecting release timing.
Let’s Learn, why the base freight rate is not the final freight cost
Terminal fluidity means that containers, vessels, trucks, equipment, systems, and information are moving through the terminal in a coordinated way. In simple terms, it means the terminal can receive, stack, locate, release, and evacuate containers without the system becoming blocked. This matters because a port delay is not only caused by a vessel waiting outside the harbour. Delays can also happen inside the terminal when the stack is congested, bookings are limited, equipment is not available, containers cannot be located quickly, system information is not accurate, or trucks cannot enter and exit efficiently.
In practical terms, terminal fluidity depends on several things working together at the same time. The vessel must berth, cranes must work, containers must be moved into the stack, the stack must have enough space, the terminal system must show accurate information, carrier release must be in place, transporters must secure bookings and trucks must be able to evacuate containers without excessive standing time.
Where businesses get caught
• Assuming a vessel has arrived therefore the cargo is nearly ready
• Assuming a container is available because the vessel has completed discharge
• Not checking whether the stack position, release and transporter booking are aligned
• Promising delivery before confirming terminal access and free days
• Treating port delay as only a shipping-line issue when the landside process is also constrained
• Missing the point that storage, demurrage, detention, and truck standing time can all arise from poor terminal fluidity
Quick example
An importer sees that the vessel has arrived at Durban and tells the customer that delivery should happen shortly. The vessel may have arrived, but the terminal is congested, the container is sitting in a difficult stack position, the carrier release is delayed, and the transporter cannot secure a suitable booking.
The cargo is technically in South Africa, but it is not yet under control. The business can then face storage, demurrage, truck standing time, delayed delivery, and pressure from the customer even though the container has already been discharged.
Takeaway
A shipment is not under control simply because the vessel has arrived or the container has been discharged. Before promising delivery, check the actual vessel position, terminal status, stack availability, carrier release, free days, transporter booking and whether any storage or demurrage exposure is developing. When terminal fluidity breaks down, the risk moves quickly from operations into cost, cash flow, and customer service.
NEWS
Durban Gateway Terminal in ‘crisis’ – freight forwarders
Freight News
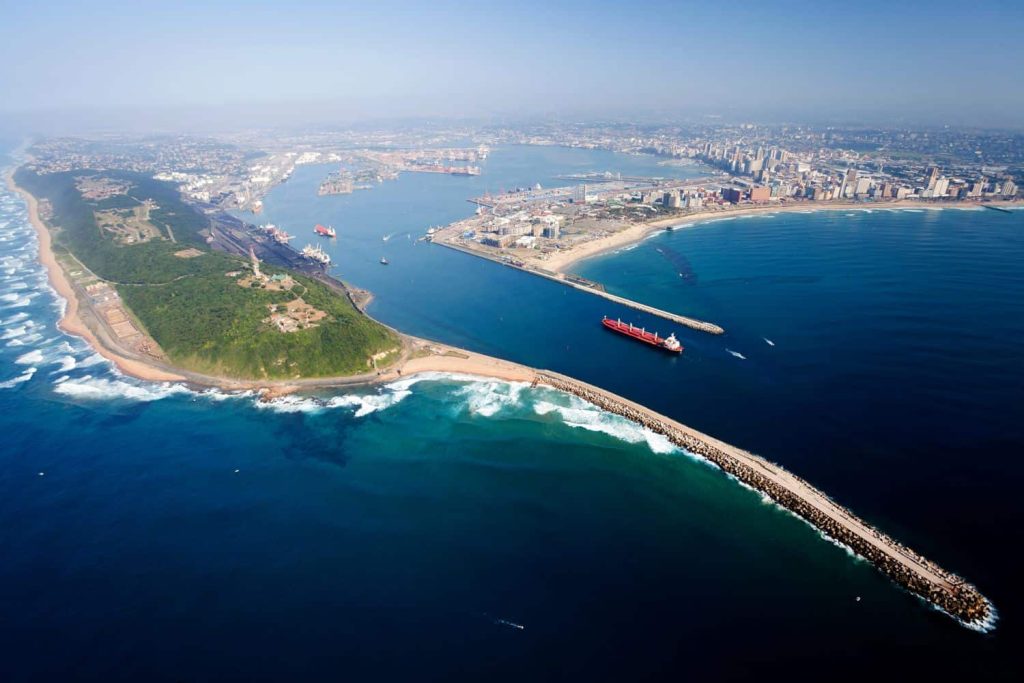
Freight forwarders say operational and equipment constraints at Durban Gateway Terminal have disrupted container
flows and caused knock-on effects across the national supply chain. Source: Arrive Alive
Durban Gateway Terminal has moved from an operational pressure point into a formally declared industry crisis. Freight News reported on 21 August that SAAFF has declared a crisis at the privately operated terminal, saying operational and equipment constraints have choked the flow of cargo and created knock-on effects across the national supply chain. The crisis followed the transition to DGT’s independent NAVIS N4 system, but SAAFF has made it clear that the problem is broader than a system implementation issue. The disruption has been compounded by operational, equipment, yard, and coordination constraints, with the association warning that container flows have become severely restricted.
SAAFF has escalated the matter to the Presidency because the relevant port structures have not been able to contain and resolve the situation. A Presidency delegation visited the port on Friday to assess the position and support efforts to mobilise an appropriate response. This is significant because the issue is no longer being treated as a terminal-level problem only, it is now being approached as a national supply chain recovery issue. The immediate priority is to restore fluidity across the terminal and its connected logistics chain. SAAFF has called for coordinated intervention across waterside, yard, landside, rail, and back-of-port operations instead of trying to optimise individual activities in isolation. That point matters because a container terminal only works properly when vessels, cranes, stacks, gates, trucks, rail, and system information are all aligned.
For cargo owners and importers, the commercial risk is direct. When terminal fluidity breaks down, the impact moves quickly into vessel delays, container release delays, truck booking problems, storage, demurrage, detention, truck standing time and missed delivery commitments. SAAFF has also said that costs arising from system and operational delays beyond industry’s control should not simply be transferred to cargo owners, freight forwarders or other affected parties through avoidable storage and demurrage charges. SAAFF has shared proposed recovery measures with Transnet, including restoring booking capacity and container evacuation, improving stack fluidity and accuracy, increasing equipment availability, strengthening rail integration, and using available capacity elsewhere in the port where practical. The industry has also called for clear, verified, and regular operational communication, including headline performance indicators that allow the wider supply chain to plan against actual terminal conditions.
The practical message for clients is that Durban cargo must now be managed shipment by shipment. Before committing to a delivery date or final cost, cargo owners should confirm the vessel position, terminal status, stack availability, carrier release, transporter booking, free days and whether any storage, demurrage, detention, or truck standing exposure is developing.
What to monitor: DGT recovery progress, Presidency and SAAFF intervention updates, booking availability, stack fluidity, equipment availability, container evacuation, rail integration, verified operational communication, demurrage, and storage exposure and whether Durban terminal conditions improve enough to restore reliable cargo flow.
Port Operations Update:
- Durban 6 days
- Cape Town 6 days
- Coega 3 days
- Port Elizabeth 1 day
South African port conditions remain under pressure this week, with Durban and Cape Town both showing elevated congestion indicators. Current GoComet data shows Durban at approximately 6 days, Cape Town at approximately 6 days, Coega at approximately 3 days and Port Elizabeth at approximately 1 day. These are public port congestion indicators and should not be treated as guaranteed waiting times for every vessel or container, because individual terminals and vessels can perform materially differently.
Durban:
Durban remains the main operational and commercial watch point. The issue is no longer only a general congestion problem; it is now centred on Durban Gateway Terminal and the recovery after the NAVIS N4 transition. Freight News reported that a backlog developed after the terminal operating-system upgrade disrupted landside operations at DGT. DGT handled 25 793 TEUs between 10 and 16 August, down 26% week on week and only 66% of target. Vessels spent an average of 66 hours at anchorage and 70 hours at berth, while the number of container vessels waiting outside Durban increased to 10 by 19 August, with seven for DGT, two for Pier 1 and one for Point. Maersk reported vessel waiting times of eight to 12 days. SAAFF has now declared the DGT situation an operational crisis and escalated it to the Presidency. The association says the problem is broader than the NAVIS system itself and includes operational, equipment, yard and coordination constraints that have choked container flow. SAAFF’s priority is the restoration of system fluidity across waterside, yard, landside, rail, and back-of-port operations. For clients, the main risk is storage, demurrage, detention, truck standing time and missed delivery commitments caused by delays outside their direct control.
Cape Town:
Cape Town is currently showing an estimated congestion indicator of approximately 6 days, which requires closer attention than last week. Cape Town remains highly sensitive to wind, weather disruption, vessel cut-offs, and cold chain timing. Exporters should check vessel schedules, stack opening, reefer availability, cold store handovers, and terminal status before moving cargo to port or confirming customer delivery expectations.
Coega / Ngqura:
Coega is currently showing an estimated congestion indicator of approximately 3 days. This is lower than last week’s elevated position but still needs to be checked shipment by shipment. Where cargo is being routed through the Eastern Cape as an alternative to Durban or Cape Town, the current indicator should not be treated as a guarantee of low risk. Vessel berthing, stack timing, carrier release, and road transport availability still need to be confirmed before committing to delivery or onward movement.
Port Elizabeth:
Port Elizabeth is currently showing an estimated congestion indicator of approximately 1 day, making it the most stable of the four public indicators this week. Even so, exporters and importers should still check vessel-specific updates, carrier schedules, transhipment arrangements, and terminal readiness before relying on planned dates.
The practical message this week is that port risk is not sitting in one place. Durban remains important but Coega and Cape Town now need more attention than they did last week. A lower national average or a better weekly throughput figure does not automatically mean a shipment will move smoothly. Each shipment still needs to be managed against the specific port, terminal, vessel, stack, carrier release and road transport plan.
What to monitor: Durban Gateway Terminal recovery, SAAFF and Presidency intervention updates, DGT booking availability, stack fluidity, equipment availability, carrier release, transporter bookings, demurrage and storage exposure, Cape Town weather delays, Coega vessel berthing, Port Elizabeth stability and whether port conditions change carrier routing or delivery commitments. Source:Adapted from GoComet South Africa Port Congestion Data, checked 24 August 2026.
Key Highlights from Last Week’s Discussions – 18 August 2026
Source: BUSA, SAAFF, and global logistics data
Port Operations
South African container terminals handled 83 471 TEUs during the week of 10 to 16 August, a decrease of 19% from the previous week’s 103 678 TEUs. The daily average declined to 11 924 TEUs, compared with 14 811 TEUs the previous week. BUSA / SAAFF notes that the weekly throughput was also below the projected average of 12 943 TEUs.
Performance declined across all major container terminals. Durban Gateway Terminal handled 25 793 TEUs, down 26% week on week and only 66% of target. Pier 1 handled 14 250 TEUs, down 12%. Cape Town Container Terminal handled 15 310 TEUs, down 4%, Ngqura handled 16 737 TEUs, down 20% and Port Elizabeth handled 4 594 TEUs, also down 20%.
Durban remains the main operational concern. DGT’s vessel time at anchorage improved from 131 hours to 66 hours, with average berth time of 70 hours, but the lower vessel waiting time does not mean the operation had recovered. BUSA / SAAFF says DGT’s waterside volumes fell sharply and that the NAVIS upgrade shutdown over the weekend significantly affected operations, with delays spilling into the current week as the terminal and industry work through the backlog. By 19 August, 10 container vessels were waiting outside Durban at anchorage, with seven for DGT, two for Pier 1 and one for Point. BUSA / SAAFF also notes that DGT’s reduced yard fluidity and stack occupancy above 80% impaired vessel productivity, while Maersk reported vessel waiting times of 8 to 12 days.
Key Insight: The port system moved less cargo last week and Durban Gateway Terminal remains the main risk. The issue is not only vessel waiting time, it is system fluidity across the yard, stack, landside, vessel operations and terminal coordination.
Air Cargo
International air cargo through OR Tambo was mostly stable, with total weekly volume of 6 717 tonnes, down 1% week on week. Inbound cargo was 4 209 tonnes, down 1%, while outbound cargo was 2 508 tonnes, also down 1%. The daily average was approximately 601 000 kg inbound and 358 000 kg outbound. Current OR Tambo volumes remain approximately 3% above August 2025 but around 2% below August 2019. Fuel stock levels were reported at 6.6 days for OR Tambo, 3.9 days for Cape Town International and 11.6 days for Durban. Cape Town was slightly below its four-day target, while OR Tambo and Durban were above target.
Key Insight: Air cargo remained broadly stable despite a slight weekly decrease. It remains a practical option for urgent cargo but should still be costed carefully, especially as global air cargo volumes softened and rates remain materially higher than last year.
Road and Border Crossings
Lebombo truck volumes increased slightly during the week, with traffic rising to 1 533 heavy goods vehicles per day, up 3% week on week. Queue times improved slightly to approximately 4.2 hours, down 2%, while processing times also improved to approximately 4.2 hours per crossing. The wider SADC border picture weakened slightly. Average cross-border queue time increased to approximately 6.9 hours, up from 6.6 hours the previous week. Average cross-border transit time increased to approximately 6.7 hours, up from 6.5 hours. South African-controlled border crossing times increased to approximately 9 hours, up 17%, while the wider SADC region remained broadly stable at approximately 6.4 hours, up 2%.
The total estimated indirect cross-border delay cost increased to approximately US$36.4 million, or R589 million, up 5% from the previous week’s estimate of approximately R562 million. Four SADC borders again took a day or more to cross on average, namely Beitbridge, Chirundu OSBP, Cuchamano and Kasumbalesa, with Kasumbalesa remaining the worst affected at around three days from the Zambian side.
Key Insight: Lebombo improved slightly despite higher truck volumes, but the wider border picture moved in the wrong direction. Border costs remain material and key regional pressure points still need to be checked before committing to delivery timelines.
Rail and Inland Movement
Rail cargo handled out of Durban on the ConCor line decreased to 2 161 containers, down 33% from the previous week’s 3 232 containers.
Key Insight: The rail decline is important because Durban is already under pressure from DGT’s terminal disruption. When terminal fluidity weakens and rail movement also declines, more pressure can shift into road evacuation, truck bookings and container dwell time.
Ocean Freight and Global Shipping
Global port congestion remains a material constraint on liner shipping. BUSA / SAAFF reports that Sea-Intelligence estimates persistent delays are removing approximately 1.7 million TEUs of effective capacity from the market. Global congestion is being driven by weather, high yard utilisation, vessel bunching, and landside constraints.
BUSA / SAAFF also notes that the global containership orderbook has reached a record 41.7% of the existing fleet, with carriers continuing to pursue market share and capacity expansion. However, the benefit of new capacity is still being offset by congestion, schedule disruption, and geopolitical risk.
The Strait of Hormuz remains effectively constrained. Kpler data recorded only nine commodity-vessel transits on Wednesday, still far below normal levels. The disruption continues to increase rerouting, insurance, bunker, and schedule-reliability risks, especially for Gulf services and cargo moving through regional transhipment hubs.
Key Insight: Global shipping capacity is not the only issue. Congestion and geopolitical disruption continue to remove effective capacity from the market, which supports the need to check space, routing, surcharges, and schedule reliability before confirming landed costs.
Global Air Cargo
Global air cargo softened in early August, with worldwide chargeable weight falling 4% week on week during week 32. Volumes remained 1% above last year, while capacity slipped by 1%. Global rates eased slightly from US$2.96/kg to US$2.95/kg but remained 22% above last year. This means pricing remains resilient despite softer demand.
Key Insight: Global air cargo demand softened but rates remain elevated compared with last year. Airfreight should still be reserved for cargo where urgency, value or service requirements justify the cost.
Monthly Port Picture
TNPA’s July update showed that total container throughput was 411 056 TEUs, down 10% month on month and 6% year on year. Total bulk cargo was 18.929 million tonnes, down 1% month on month but up 11% year on year. Vehicle throughput was 84 646 units, down 3% month on month but up 12% year on year. Despite the July reduction, year-to-date container throughput remains up 6.8% year on year.
Key Insight: The monthly data shows that the national port picture is mixed. Volumes are not collapsing but week-to-week execution remains uneven, especially where a single constrained node such as DGT affects the wider logistics chain.
Strategic Outlook
The latest BUSA / SAAFF update shows a weaker week for South African logistics. Container throughput declined sharply, Durban Gateway Terminal remained the main pressure point, rail movement out of Durban fell and cross-border delay costs increased. Air cargo was the most stable part of the picture, declining only slightly. The key message is that logistics performance is a system outcome. A terminal can show better vessel waiting time but still perform poorly if yard fluidity, stack occupancy, landside evacuation, and communication are not aligned. Durban Gateway Terminal is the clearest example this week: the problem is not only what happens at the berth but whether cargo can move through the full terminal and connected supply chain.
The practical message for cargo owners is to manage Durban cargo carefully and shipment by shipment. National averages are useful, but they are not enough. Each shipment still needs to be checked against the specific terminal, vessel, stack, carrier release, transporter booking, rail availability, free days and final landed cost before delivery dates or customer pricing are confirmed.
What to monitor: Durban Gateway Terminal recovery, stack occupancy, yard fluidity, NAVIS N4 stabilisation, vessel waiting times, rail container movements out of Durban, Cape weather disruption, weekly TEU volumes, OR Tambo air cargo stability, SADC border delay costs, global port congestion and whether DGT recovery measures restore reliable cargo flow.
Global Freight Rates
Drewry’s latest World Container Index increased 4% to US$4 526 per 40ft container on 20 August 2026, its third consecutive weekly increase. Drewry says the movement was driven by higher Transpacific rates, while Asia to Europe remained softer. The strongest upward pressure came from the Transpacific trade. Drewry reported that the latest increase was supported by higher rates on Asia to US routes, while rates on Asia to North Europe and Mediterranean trades remained under pressure. The important point for South African importers is that global pricing is no longer easing in a straight line, even where demand is uneven.
Blank sailings remain part of the rate picture. Drewry’s Cancelled Sailings Tracker shows 49 blank sailings expected across the major East West trades from week 35 to week 39, covering 24 August to 27 September. This represents a 6% cancellation rate, with 94% of scheduled sailings still expected to operate. Intra-Asia rates also moved higher. Drewry’s Intra-Asia Container Index rose 6% to US$1 091 per 40ft container on 20 August. Drewry linked the stronger market to renewed US-Iran hostilities, recent vessel attacks, and cautious market sentiment. This matters for South African importers because many shipments from Asia can be affected before they even connect onto the South Africa trade, especially where feeder schedules, equipment availability, weather disruption, or regional congestion are involved.
The practical message is that importers should not assume lower rates will continue. Drewry does not measure South Africa directly in the WCI, but global pricing direction, Asia origin congestion, blank sailings, and carrier surcharge behaviour all influence the pricing environment. The CMA CGM surcharge covered this week reinforces the same point: the base ocean freight rate is not the final landed cost. Before approving customer pricing or landed costs, importers should confirm the carrier, sailing, loading date, rate validity, Peak Season Surcharge, bunker or emergency fuel charge, routing, transhipment plan, free time, and local charges.
What to monitor: Drewry’s next WCI movement, Transpacific rate strength, Asia to Europe softness, CMA CGM surcharge implementation, blank sailing exposure, Intra-Asia rate movement, China and North Asian congestion, Middle East routing risk and whether carrier capacity discipline continues into September. Source: Drewrey World
Final Thoughts
This week’s update shows that the Durban issue has moved beyond normal port congestion, Durban Gateway Terminal is now a system-fluidity problem, where the weakness is not only at the berth but across yard flow, stack accuracy, booking capacity, equipment availability, landside evacuation, rail integration, and communication.
For cargo owners, this matters because the cost risk can develop quickly, a container delay inside the terminal can become storage, demurrage, detention, truck standing time, missed delivery commitments and pressure from the end customer. That is why the current SAAFF position is important. Industry is not only asking for the terminal to move faster, but also for coordinated recovery, verified communication and fair treatment where costs arise from delays outside the control of cargo owners, freight forwarders and transporters.
The BUSA numbers confirm that the impact is visible in the system, national container throughput fell sharply, Durban Gateway Terminal volumes were materially lower and rail movement out of Durban also declined. At the same time, global freight rates have moved higher again and Drewry is still showing blank sailings across the major East West trades. This means the risk is coming from both sides: local execution pressure and global pricing pressure.
The practical discipline is therefore clear. Durban cargo must be managed shipment by shipment and cost by cost. Before committing to a client, confirm the vessel position, terminal status, stack availability, release status, free days, transporter booking, rail availability and whether any storage or demurrage exposure is developing.
Operational: Check the vessel, terminal, stack, release, and transport plan before promising delivery.
Commercial: Reconfirm the freight rate, surcharge position, validity, free time, and local charges before approving landed cost.
Planning: Build flexibility into Durban timelines until DGT recovery is visible, measured, and stable.
The businesses that manage this period well will be the ones that do not wait for the delay or surcharge to appear. They will be the ones that check earlier, communicate sooner, and protect margin before the shipment moves.
Disclaimer:The information provided in this newsletter is based on reliable sources and has been carefully verified. This Logistics News is distributed free of charge. If you wish to unsubscribe from our mailing list, please reply to this email with “unsubscribe” in the subject line. Please note that all content is adapted or directly quoted from its original sources. We take no responsibility for any inaccurate reporting; we are only adapting the news for you.
This week’s news was brought to you by:
FNB First Trade™ 360 — your partner in logistics and Exporters Western Cape