
Welcome to another Logistics News Update.
Buckle up for an extended period of high shipping rates!
The ongoing crisis in the Red Sea, port congestion, and high demand for goods in China are causing container rates to surge. Maersk and other carriers are revising their financial outlooks upwards, meaning the cost of shipping containers is expected to stay high for the foreseeable future. This translates to potential price increases on imported goods for businesses and consumers in South Africa, likely exceeding the $10,000 per container rates expected on routes from China to North America and Europe, South Africa will no avoid high rates due to the limited space and “lack of equipment”. We covered the pricing in last week’s newsletter.
Adding to these woes, South African ports performed poorly in the CPPI ranking, with Durban citing equipment availability as a major challenge. Read the full story below.
Here’s what you need to know:
- Limited Space: Securing space for your shipments may be difficult until July/August 2024.
- Rising Costs: Brace yourself for potentially even higher rates.
- Premium Options: Some shipping lines offer “diamond tier” options with guaranteed space, but at a premium cost.
The Bottom Line: Careful planning and staying informed are crucial during this time. We’ll provide further insights and tips for navigating this challenging landscape in the coming sections of this newsletter.
Forex Tip of the week:
Exploring the INCOTERM FOB – Free On BoardFOB, or Free On Board, is a common incoterm used in international shipping contracts. Think of it like splitting the responsibility of getting your goods overseas with your buyer. Here’s the breakdown:
- You (seller) handle: Getting your product to the port (think of it like delivering it to the airport for a flight). You’re responsible for any export clearance procedures too.
- Buyer handles: Everything from there on out. They arrange the transport (think booking the flight), pay for any freight costs, insurance, and any import fees or customs duties on their end. They also take the risk of damage during transport – if those surfboards get dinged on the way to South Africa, it’s on the buyer to claim from their insurance.
The key thing for South African businesses is that our ports haven’t been ranking highly in terms of efficiency lately. This can be a double-edged sword with FOB:
- Pros: It’s a good option if you’re comfortable handing over responsibility at the port and the buyer has a reliable shipping partner. It can also be simpler for you as a seller since you don’t have to deal with the complexities of international shipping itself.
- Cons: With recent port delays, using FOB could mean your buyer experiences longer wait times or unexpected costs if there’s damage during that extra time the goods are stuck.
- The bottom line: FOB can be cost-effective for both parties.
On The Ground Logistics Update:
- Split Berths: While not a direct impact this week, the ongoing practice of “split berths” (vessels using multiple terminals to offload containers) can cause confusion and hinder cargo tracking for importers.
- Global Shipping Rates: Shipping rates, particularly those from China, have risen back to pre-pandemic levels, placing a burden on South African importers and exporters.
Disclaimer: Please note: All information presented in this post is based on reputable sources and has been referenced accordingly, this Logistic News is obligation free and if you wish to be removed from the mailing list, please reply to this mail requesting to be removed.
NEWS
Dead last among 405 ports – SA flies the CPPI rogues flag again
05 June 2024 – by Staff reporter
The global Container Port Performance Index (CPPI) reveals that East and South-east Asian ports excelled in 2023, accounting for 13 of the top 20 places.
Developed by the World Bank and S&P Global Market Intelligence, the fourth edition of CPPI, released on Tuesday, is based on the biggest data set ever with more than 182 000 vessel calls, 238.2 million moves, and about 381 million TEUs for the full calendar year.
More than 80% of merchandise trade is transported by sea, so the resilience, efficiency, and overall performance of ports is crucial to global markets and economic development.
South Africa’s four container ports continued to rank among the worst-performing ports in the world, with Cape Town finding itself in last place, of the 405 ports listed in the index.
Ngqura was ranked second to last at 404, while Durban was ranked at 399, followed by Port Elizabeth at 391, while regional ports Walvis Bay and Maputo were ranked slightly ahead at 392 and 317 respectively.
Regional disruptions impacted port performance everywhere, according to the report.
“While the challenges caused by the COVID-19 pandemic and its aftermath eased further in 2023, container shipping continues to be an unpredictable and volatile sector,” said Martin Humphreys, lead transport economist at the World Bank.
“Major ports need to invest in resilience, new technology and green infrastructure to ensure the stability of global markets and the sustainability of the shipping industry.”
Source: Freight News
Trade in DBN and Richards Bay on an upward trajectory
10 May 2024 – by Liesl Venter

Durban’s business confidence, reflecting the broader region, has been on an upward trajectory for some time, despite facing significant challenges.
According to Palesa Phili, CEO of the Durban Chamber of Commerce and Industry NPC, recent findings from economic intelligence platform Durban EDGE indicate robust growth in imports of 7.5% and exports of 23.1% from 2022 to 2023.
“As organised business, we believe Durban is well-positioned to serve its international trade partners. With the busiest port in sub-Saharan Africa and Dube TradePort strategically supporting the manufacturing sector, Durban offers prime opportunities,” Phili said.
The Chamber, through its various forums, remains committed to promoting trade and investment in the city.
Speaking to Freight News, Phili expressed growing optimism for the city and the broader region, highlighting concerted efforts to support and expand trade initiatives.
Earlier this year, the first shipment of South African products under the African Continental Free Trade Area initiative left the country en-route to Ghana from the Port of Durban.
Phili said ongoing efforts were in place to connect businesses in Durban to the international market and several trade delegations had already been hosted this year.
Source: Freight News
PORTS
Bad weather hurt port operations last week.
- Strong winds and rain caused delays in Cape Town and Durban.
- Several cranes are out of service in Durban.
- No reports from Ngqura Container Terminal (NCT) or Port of East London.
Cape Town:
- Increased truck and rail activity at the container terminal (CTCT).
- Lower vessel traffic due to bad weather.
- Multiple cranes (LC1, LC3, LC5, LC9) are out of commission with no repair ETA yet.
- Multi-purpose terminal (CTMPT) had minimal activity.
Durban:
- Strong winds impacted operations at both Pier 1 and Pier 2.
- Several cranes (520, 521, 523, 526, 533, 01, 04) are out of service.
Richards Bay:
- Coal terminal handled 103,050 tons despite having some anchored vessels.
- TNPA awarded a contract for a 20MW solar PV plant at the port.
Eastern Cape Ports:
- No reports from NCT.
- GCT had one vessel berthed and handled 266 TEUs.
- Reefer stack occupancy is high (89%) and closed for new containers.
- No reports from Port of East London.
The hidden costs of international trade and transport
A new dataset by UNCTAD and the World Bank, introduced at the first Global Supply Chain Forum, offers a detailed global overview of transport’s role in trade.17 It includes the cost of moving different products between over 170 economies from 2016 to 2021, utilising national data from UN Comtrade. The dataset details the value and volume of merchandise, transport costs, and the effort needed per shipment, broken down by commodity group and transport mode. For the first time, it correlates trade data by country, commodity, and mode of transport, illuminating the transport costs and necessary efforts for imports and exports among countries. This comprehensive data, accessible through UNCTADstat, includes advanced tools like APIs for user-specific data extraction, enhancing its utility for policymakers, businesses, and researchers. Note: Transport work is calculated by multiplying the weight of the goods by the distance they need to be shipped.
Global Container Summary
Soaring global container freight rates
On May 31, the Shanghai Containerised Freight Index (SCFI) showed a ↑12,6% increase in spot ocean rates ex Shanghai, the 10th consecutive week of rising rate levels. At 3 045 points, the rate index is still well below its historical peak of 5 110 points registered on 7 January 2022 during the COVID-19 pandemic. A comparison, however, shows that average spot rates are almost three times higher than a year ago, which has significantly boosted shipping lines’ profits once more:
Figure 17 – SCFI revenue per nautical mile (US cents/TEU)
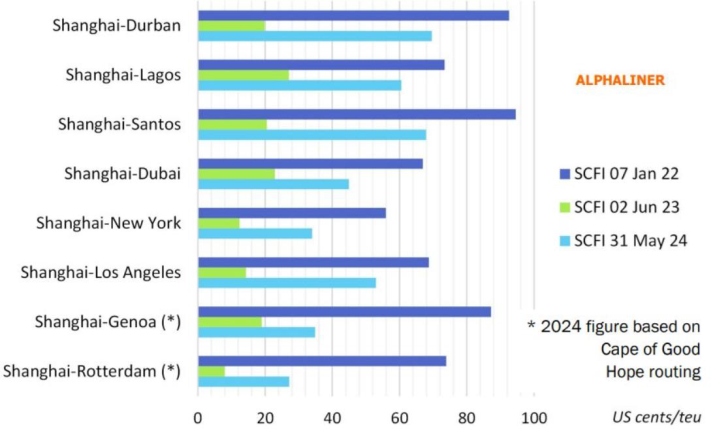
Spot ocean freight rates have been rising rapidly since early April due to a combination of solid cargo demand in China and a shortage of ships. A recent Alphaliner report in mid-May showed the big alliance carriers were short of 36 vessels to fully staff all their Far East—Europe loops, which are being re-routed via the Cape of Good Hope. From Drewry’s perspective, the “World Container Index” increased by a similar magnitude, up by ↑11,6% (or $490) to $4 716 per 40-ft container. 18 The following figure shows the movement in the last two years:
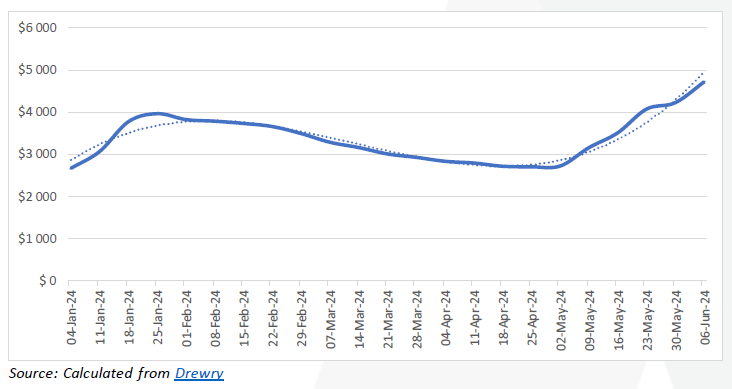
The composite index increased by ↑181% compared to last year’s week and is more than double (↑232%) compared to the 2019 pre-pandemic rates of $1 420. The recent upsurge in spot rates is beginning to affect long-term contracts, and over the past few months, something of a two-tier market appears to have developed.19 In the charter market, rate increases have also picked up pace this week, as the Harper Petersen Index (Harpex) is currently trending at 1 627 points, up by ↑10,3% (w/w) and up by ↑32% (y/y) versus this time last year 20.
BUSA-SAAFF Summary
In concluding this edition, two significant international developments highlight South Africa’s trade, transport, and logistics plight. Firstly, the additional (and sometimes hidden) cost of doing business across borders severely impacts many firms in developing countries, including South African firms. This reality is especially the case in the current climate against a backdrop of another quarter without any growth (South Africa’s GDP decreased by ↓0,1% in the first quarter of 20246). And secondly, the World Bank once again ranked South Africa’s ports at the bottom of the pile, which poetically coincides with the worst week concerning port volume for the year. Although there has been critique on CPPI’s methodology (which has been documented by others, including what has been described as (1) the unidimensional view of performance, (2) limited data coverage, and (3) being focused on waterside and berth operations), we would still not want to be considered as the worst – and we are not where we should be. Therefore, much work needs to be carried out in our industry. The elections have brought a new dawn that will hopefully propel our country to the next level. Whatever transpires politically, the same is true for our logistics network, as we have no option but to create a new dawn – one where the focus is on utilising trade, transport, and logistics as a critical driver for economic growth and development.
Source: BUSA
This week’s news was brought to you by:
FNB First Trade 360 – a digital logistics platform and Exporters Western Cape.
“This information contained herein is being made available for indicative purposes only and does not purport to be comprehensive as the information may have been obtained from publicly available sources that have not been verified by FirstRand Bank Limited (“FRB”) or any other person. No representation or warranty, express, implied or by omission, is or will be given by FRB, its affiliates or their respective directors, officers, employees, agents, advisers, representatives or any other person as to the adequacy, reasonableness, accuracy or completeness of this information. No responsibility or liability is accepted for the accuracy or sufficiency thereof, or for any errors, omissions or misstatements, negligent or otherwise, relating thereto. In particular, but without limitation, no representation or warranty, express or implied, is given as to the achievement or reasonableness of, and no reliance should be placed on, any projections, targets, estimates or forecasts and nothing contained herein should be, relied on as a promise or representation as to the past or future. FRB does not undertake any obligation to provide any additional information or to update the information contained herein or to correct any inaccuracies that may become apparent. The receipt of this information by any person is not to be taken as constituting the giving of any advice by FRB to any such person, nor to constitute such person a client of FRB.”