Welcome to another Logistics News Update.
It’s time to plan to work within an “abnormal” situation to create our new “normal” when it comes to import and export planning.
Let’s be honest, we have seen the CEO of Transnet Michelle Phillips tell everyone that we are not the worst in the world (last week it was reported that we were last on the world ranking for ports KZN 399 and CPT 405). So now that we know that, what are we doing about it? There is nothing you can do except start to work in an abnormal situation and start to plan with that in mind. Durban is plagued with equipment failures, that is the biggest reason for our failures at the ports and that is what is causing congestion and huge delays.
So, if you know what is causing the delays, that is it and added to that the world ports are not playing the game and there is congestion in Singapore, Dubai, Europe and the list goes on, now add to that the lack of equipment (containers) causing the rates to sky rocket out of the Far East and the shipping lines (some of them) charging $2000 (R40’000) peak season surcharge (PSS – for when you see it on an invoice). However, she admits that Cape Town port, vital for agricultural exports, is missing targets, partly due to equipment issues and inclement weather.
With rates on the rise, as we mentioned last week, it’s crucial to plan accordingly. Given the port’s consistent inefficiencies, make sure to factor this into your strategy.
Forex Tip of the week
What is a Letter of Credit (L/C)? & Why do you need it?This is a written, irrevocable undertaking by the Importer’s Bank that the Exporter will receive payment against documentary evidence, provided that the T&Cs stipulated in the L/C were met. Some of the documentary credit types that FNB offers. Standby L/C Irrevocable Confirmed CreditTransferable CreditRevolving CreditIf I use an L/C, is payment guaranteed? Payment is only guaranteed if all the terms and conditions of the L/C are met. If there are any discrepancies, the guarantee of payment falls away, and all parties will need to accept the discrepancy/ies, before payment can take place. Can an L/C be cancelled? – An L/C can only be cancelled if all parties, including the banks involved, agree to cancel the instrument. Why you need it?Imports have the risk that their supplier does not deliver the goods once they have paid for them. A letter of credit can be used to guarantee payment to the exporter while simultaneously assuring the importer that payment will not take place until the exporter has shipped the goods.
On The Ground Report
It may feel like déjà vu, but the Port of Durban continues to face the same challenges daily. Vessels are bypassing the port, causing frustration among clients. This issue is further exacerbated by delays from overseas. Truck drivers are still spending excessive time in the port, and truck operators are struggling to secure bookings.
Disclaimer: Please note: All information presented in this post is based on reputable sources and has been referenced accordingly, this Logistic News is obligation free and if you wish to be removed from the mailing list, please reply to this mail requesting to be removed.
NEWS
South Africa’s sea freight competition in Chile up their game
12 June 2024 – by Staff reporter
While the Port of Cape Town has sunk to the bottom of the world rankings, South Africa’s competition has made significant improvements, a worrying development for the country’s horticultural exporters.
Chile is a major competitor of the South African fruit industry, and its two prominent export ports, San Antonio and Valparaiso, significantly improved their positions on the latest global Container Port Performance Index (CPPI).
San Antonio rose from 253 to 110 and Valparaiso from 188 to 151.
“Productive ports attract more vessels, leading to increased shipping capacity, possibly lower shipping fees, and more shipping options,” said Chris Knoetze, managing director of Link Supply Chain Management, a logistics company co-owned by Tru-Cape, South Africa’s largest apple and pear exporter.
“It also ensures a constant flow of products to the market, putting the Chileans in a more competitive position. “To improve our international competitiveness, it is crucial to sort out the crisis in our ports,” he added.
Industry body Hortgro estimates that the export apple and pear crop will increase by 6% and 5% respectively this year. Most of this fruit is supposed to be shipped from the Port of Cape Town, but logistical challenges have forced exporters to implement costly alternatives, such as road freight to Gqeberha and exporting from there.
Knoetze is not surprised at Cape Town Port’s position at the very bottom of the index since it is based on 2023 data.
“All other South African ports moved down on the index, indicating that the problem lies with Transnet. However, during the past six to eight months, some constructive staff changes occurred at the freight giant, and a detailed terminal recovery plan was put into action.”
Source: Freight News
‘We’re not the worst in the world’
SA’s ports are improving, and World Bank ranking is inaccurate, says Transnet group CEO Michelle Phillips

Transnet Group CEO Michelle Phillips briefs media on key matters in business including implementation of the Recovery plan and Rail Reforms process at Umjantshi building at Parktown in Johannesburg on April 26. 2024.
Michelle Phillips, group CEO of Transnet, says the recently released World Bank 2023 container port performance index ranking South Africa’s ports as the worst in the world is inaccurate, unhelpful and serves no useful purpose.
It can’t be used to help improve the competitiveness of ports such as Cape Town, Ngqura and Durban, which it ranked as the worst in the world at 405,404 and 398 respectively, she says.
“If the index measured container terminal performance accurately it would be a good tool, but based on the conversations I’ve had that’s not the case.” Phillips says she’s not denying the ports are still seriously challenged despite reforms she has driven since becoming acting group CEO in November last year.
“We’re not saying there are no challenges. Of course, we still have challenges. Until we have the equipment and infrastructure we require in place, we will probably continue to limp. But with what we have, I think everybody can say we’ve done pretty well. Our customers are certainly beginning to feel the change, they’re beginning to feel the energy and transparency with which our people are engaging with them.”
Nevertheless, Cape Town port, through which more than 55% of the country’s primary agricultural products are exported, is missing targets designed by Transnet itself to be conservative and achievable.
So dire is the situation at the start of the citrus export season — potentially worth billions to the Western Cape economy — that premier Alan Winde called on Transnet months ago to send in their “top team” to improve operations at the port’s container terminal.
Source: Sunday Times – Business
PORTS
Summary of Port Operations
Weather and Other Delays:
- Cape Town: Delays due to adverse weather and equipment breakdowns.
- Durban: Strong winds and high swells affected performance.
- Eastern Cape Ports: Crane breakdowns and strong winds caused delays.
- Richards Bay: Minimal delays reported.
Cape Town:
- Dense fog and equipment issues disrupted operations, with 3,732 trucks serviced and 4,657 container moves executed.
- CTMPT saw minimal activity, with delays affecting vessel schedules.
- FPT terminal handled seven vessels, with rainy weather causing delays.
Durban:
- Pier 1: Two vessels at berth, stack occupancy at 54% for GP containers.
- Pier 2: Three vessels at berth, strong winds and high swells causing delays, stack occupancy at 60% for GP containers.
- MPT: Three vessels at berth, crane issues impacting throughput.
- Maydon Wharf MPT: One vessel at berth, minimal activity reported.
- Ro-Ro terminal: One vessel at berth, 1,279 road units handled.
Richards Bay:
- 15 vessels at anchor and 11 berthed, with active marine resources and handling of 73,832 tons of coal.
Eastern Cape Ports:
- NCT: Three vessels at berth, stack occupancy at 61% for reefers, despite equipment challenges.
- GCT: One vessel at berth, stack occupancy at 55% for reefers.
- No reports for East London.
The hidden costs of international trade and transport
A new dataset by UNCTAD and the World Bank, introduced at the first Global Supply Chain Forum, offers a detailed global overview of transport’s role in trade.17 It includes the cost of moving different products between over 170 economies from 2016 to 2021, utilising national data from UN Comtrade. The dataset details the value and volume of merchandise, transport costs, and the effort needed per shipment, broken down by commodity group and transport mode. For the first time, it correlates trade data by country, commodity, and mode of transport, illuminating the transport costs and necessary efforts for imports and exports among countries. This comprehensive data, accessible through UNCTADstat, includes advanced tools like APIs for user-specific data extraction, enhancing its utility for policymakers, businesses, and researchers. Note: Transport work is calculated by multiplying the weight of the goods by the distance they need to be shipped.
Global Container Summary
Global container trade statistics – April
The latest container throughput figures for April from Container Trade Statistics (CTS) show that container volume has decreased by ↓4,5% (m/m) after a record increase of ↑16,1% in March. Annual throughput is up by ↑6,3% (y/y), as all trade lanes saw a reduction in throughput during April, with the Far East imports seeing the most significant drop in containers discharged at ↓7,2% (m/m), and Australasia & Oceania exports seeing the most significant drop in containers loaded at ↓9,5% (m/m). The global price index (dry and reefer combined) was stable over this period and is slightly down by ↓2,4%(m/m) and ↓5,7% (y/y); however, this trend is expected to be reversed (see the latest pricing analysis below). The following figure illustrates the global container throughput and price index since October 2021:
Container market summary
Rising port congestion continues to affect international supply chain fluidity, as the global port congestion indicator continues to hover above the 2,2 million TEU mark, accounting for 7,3% of the global fleet (which is the highest level this year). In South Africa, port congestion at the Port of Durban worsened slightly in the last week, as Durban remains on the first page of Linerlytica’s “Port Congestion Watch”. On Wednesday, the queue-to-berth ratio at Durban was 0,56.12 Elsewhere globally, several new long-haul services were launched in June, including the notable return of SeaLead to the US and BAL to Mexico that followed Ellerman’s return on the Asia-Europe route last month. COSCO and Hapag-Lloyd have added new services on the transpacific and Asia-Europe routes. Market sentiment is rising, as seen by the IPO filing by TS Lines, while Maersk’s revision of its full-year profit guidance only affirms what the market already knew. All these are reminiscent of the COVID bull run of 2021, but this time, it’s all due to the Red Sea crisis that has upended the supply-demand balance while spurring the return of port congestion and box equipment shortages.
Lastly, almost no capacity is sitting idle (only ~0,3% of the total fleet), as the “Cancelled Sailings Tracker” remains stable (but slightly high) this week at 7%.14
Global container freight rates
Container freight rates continue to increase, albeit at a slower pace. Drewry’s “World Container Index” increased by ↑1,8%(or $85) to $4 801 per 40-ft container.15 The following figure shows the movement in the last year:
Spot ocean freight rates have been rising rapidly since early April due to a combination of solid cargo demand in China and a shortage of ships. A recent Alphaliner report in mid-May showed the big alliance carriers were short of 36 vessels to fully staff all their Far East—Europe loops, which are being re-routed via the Cape of Good Hope. From Drewry’s perspective, the “World Container Index” increased by a similar magnitude, up by ↑11,6% (or $490) to $4 716 per 40-ft container.18 The following figure shows the movement in the last two years:
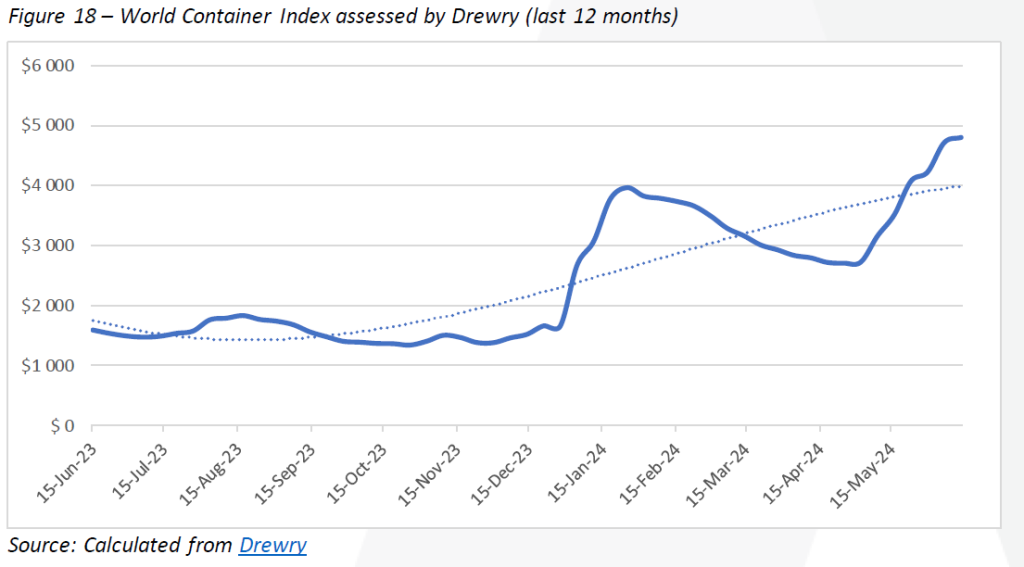
The composite index is now more than double versus this time last year (↑202%) – with most trade up around ↑2 to 3%versus last week. The continued resurgence in spot rates means that container freight rates are again heading into pandemic territory, as many trades continue to surge with quotes more than five times their respective levels of earlier in the year.16 In the charter market, rate increases have slightly cooled after last week’s massive increase but still jumped by ↑5,2% (w/w). The Harper Petersen Index (Harpex) is currently trending at 1 712 points, up by ↑39% (y/y) compared to this time last year
BUSA-SAAFF Summary
In concluding this week’s edition, it is essential to address the World Bank’s CPPI report, which recently evaluated South Africa’s port operations as the worst globally, noting significant inefficiencies during 2023 before recent corrective measures at Transnet. Despite criticisms of its single-dimensional ranking and methodological limitations, the report highlights severe delays in vessel waiting times, emphasizing areas needing improvement like container handling rates at Durban’s Piers. However, the report omits throughput volume, a crucial metric where South Africa leads in Sub-Saharan containerized throughput, making comparisons with smaller ports less meaningful. Despite recognizing a long-term decline in port productivity, particularly in container handling per hour and vessel dwell times, the industry believes it has reached the lowest point and is working on stabilizing and improving performance. This report should be used constructively to drive sector-wide efforts and strategic interventions aimed at enhancing port operations, aligning with national economic growth goals through improved trade and logistics.
Adapted from :BUSA
This week’s news was brought to you by:
FNB First Trade 360 – a digital logistics platform and Exporters Western Cape.
“This information contained herein is being made available for indicative purposes only and does not purport to be comprehensive as the information may have been obtained from publicly available sources that have not been verified by FirstRand Bank Limited (“FRB”) or any other person. No representation or warranty, express, implied or by omission, is or will be given by FRB, its affiliates or their respective directors, officers, employees, agents, advisers, representatives or any other person as to the adequacy, reasonableness, accuracy or completeness of this information. No responsibility or liability is accepted for the accuracy or sufficiency thereof, or for any errors, omissions or misstatements, negligent or otherwise, relating thereto. In particular, but without limitation, no representation or warranty, express or implied, is given as to the achievement or reasonableness of, and no reliance should be placed on, any projections, targets, estimates or forecasts and nothing contained herein should be, relied on as a promise or representation as to the past or future. FRB does not undertake any obligation to provide any additional information or to update the information contained herein or to correct any inaccuracies that may become apparent. The receipt of this information by any person is not to be taken as constituting the giving of any advice by FRB to any such person, nor to constitute such person a client of FRB.”