Welcome to another Logistics News Update.
We start this week’s update with a planned national march against illegal immigration which is expected to take place in several parts of South Africa. While the full impact on transport corridors remains uncertain at the time of writing, businesses should remain aware of the potential for localised traffic disruption, congestion, and route delays in affected areas. Transport operators, importers and exporters with time-sensitive cargo should monitor developments closely and allow additional flexibility where deliveries or collections may be affected by protest activity.
The common theme running through this week’s newsletter is that the market is still moving but the margin for error is getting smaller. Freight rates have increased sharply; weather-related disruption continues to affect parts of the Eastern and Western Cape and border performance across the region remains uneven. None of these issues are stopping trade but all of them are increasing the importance of planning and execution.
The agricultural sector continues to perform well despite weather disruption and higher logistics costs. Citrus exports remain active while flooding in the Gamtoos Valley has damaged roads, bridges, and farm infrastructure, creating additional pressure on collections, cold chain planning, and export timing. As volumes increase the ability to move cargo consistently becomes just as important as the strength of the market itself.
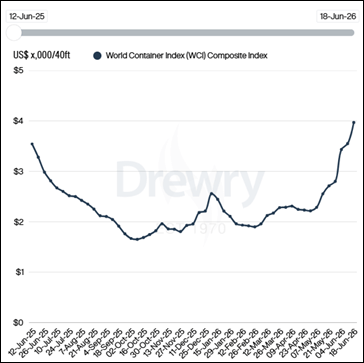
The main cost pressure remains global freight, with Drewry’s World Container Index increasing again as rates on the Transpacific and Asia-Europe trades moved higher. New safeguard duties, anti-dumping duties, and customs rebate provisions also mean importers should review tariff exposure and landed cost carefully before confirming orders or committing pricing to customers. Our view is straightforward, businesses that check rates, documents, duties, routing, and delivery requirements before cargo moves will be in a far better position to protect margin, cash flow, and customer commitments than those that react once the shipment is already under pressure.
Hopefully, the demonstrations pass without incident but if you do not need to be on the road on the 30th it may be worth avoiding unnecessary travel until the situation becomes clearer.
Agri & Transport Summary
South Africa’s agricultural export activity remains strong, but logistics costs and weather disruption continue to create execution risk. Agricultural exports reached US$3.7 billion in the first quarter of 2026 which was 11% higher than the same period last year. However, Agbiz reported that confidence in export conditions weakened during the second quarter as rising shipping costs and Middle East disruption placed additional pressure on the sector.
The citrus season has moved further into its peak period, with approximately 61 million 15kg cartons packed and 50.9 million cartons shipped by the end of week 23. Recent flooding in the Gamtoos Valley has damaged roads, bridges and farm infrastructure and has created concern around access to orchards and the movement of the remaining crop.
For exporters, the main issue is not production alone but the ability to move cargo reliably. Road access, collection planning, cold chain timing, port movement, and shipping costs must be monitored closely because delays between the farm and vessel can affect product quality, delivery commitments, and export returns.
What to monitor: Road restoration in the Gamtoos Valley and any further effect on citrus collection, packing, and export movement.
Logistics & Trade Headlines
- New steel safeguard duties are now in effect: SARS introduced a 52.34% safeguard duty on specified flat rolled iron, non-alloy steel, and other alloy steel products under Chapter 72 from 12 June 2026. The measure applies until 11 June 2027, with lower safeguard rates scheduled for the following two years. Importers should confirm the tariff classification and duty exposure before approving landed costs.
- Anti-dumping duties on Chinese PET have increased: SARS increased the anti-dumping duty on polyethylene terephthalate imported from China from 28.89% to 43.77% on 12 June. Importers of affected plastic materials should recheck tariff treatment, supplier origin, and landed cost before confirming new orders.
- South African ports have shown measurable improvement: The latest Container Port Performance Index identified Durban as recording the largest year on year improvement while Ngqura and Port Elizabeth also improved. However, Durban remains in the lower tier of the global rankings and Cape Town’s position weakened further, which means live operating conditions still need to be checked before cargo commitments are made.
- Global container freight rates have risen to an 18-month high: Drewry’s World Container Index increased by 12% to US$3,969 per 40ft container on 18 June. Transpacific and Asia to Europe rates increased as cargo was brought forward and carriers implemented peak season and fuel related surcharges.
- Global air cargo rates remain elevated despite improving capacity: Xeneta reported that average global air cargo spot rates reached US$3.40 per kilogram in May, which was 41% higher than a year earlier. Capacity recovered to 1% above the previous year but pricing remained under pressure across several important trade lanes.
- Suez Canal transit surcharges will increase from 15 July: The Suez Canal Authority announced higher surcharges across several vessel categories including a 12% surcharge for containerships. Although many services continue routing around southern Africa, the change could affect future carrier routing and the commercial case for returning to the canal.
- Strait of Hormuz conditions remain uncertain: Drewry reported that a framework agreement announced on 15 June improved shipping market sentiment but operational conditions around the strait remained fragile. South African cargo owners should continue monitoring the possible effect on bunker fuel costs, insurance, carrier routing, and freight surcharges.
What to monitor: Further freight rate increases, new carrier surcharges, and the practical implementation of recently announced South African customs and infrastructure changes.
Let’s Learn, why a freight estimate can differ from the final invoice
A freight estimate is prepared using the information available before the shipment moves. The final invoice is based on what actually happened during the shipment. This is why the final cost can sometimes be higher or lower than the original estimate even where the quoted freight rate has not changed.
In practical terms:
An estimate normally relies on the expected cargo weight, dimensions, tariff code, collection point, delivery address, exchange rate, and planned routing. Once the cargo moves the carrier, terminal, customs authority, and transport provider apply charges based on the actual shipment details and events.
The difference is not always caused by the freight rate. It may result from additional handling, customs examinations, storage, waiting time, amendments or incorrect information supplied before shipment.
Where people get caught:
• The actual cargo weight or dimensions differ from the supplier’s original information
• The shipment is collected or delivered outside the quoted area
• Customs selects the cargo for inspection or documentary review
• The container remains at the port or depot beyond the available free time
• Shipping instructions or documents need to be amended
• The exchange rate changes between the estimate and final billing
• The tariff classification results in different duty or VAT from what was expected
• The carrier applies a surcharge that was not confirmed when the estimate was prepared
Quick example:
An importer receives an estimate based on a 20-foot container weighing 15 tonnes. The final packing list shows that the container weighs 22 tonnes and the delivery requires additional equipment because of site restrictions. The ocean freight may remain unchanged, but the inland transport and handling charges can increase because the actual shipment is different from the information originally quoted.
Takeaway:
An estimate is only as accurate as the information used to prepare it. Importers should provide complete cargo details, final supplier documents, the correct delivery address, and any site restrictions before accepting the estimate. Where information changes after the estimate is issued it should be updated immediately so that the likely cost can be reviewed before the shipment moves.
NEWS
Island View access framework moves towards implementation
Government is moving into the next phase of opening Durban’s Island View liquid bulk precinct to qualifying new participants. Transport Minister Barbara Creecy confirmed that the terminal operator agreements required under the Section 79 directive have been concluded and that the third-party access framework has been finalised. Island View is a strategically important part of South Africa’s fuel import, storage, and distribution network. The framework provides for ring fenced terminal capacity intended to give qualifying new participants access to infrastructure that has historically been difficult to enter.
The policy framework is largely complete, but the process is not yet fully operational. TNPA is identifying sites that will be marketed through a special purpose vehicle while government is finalising the participation mechanism, governance arrangements, operating procedures and capacity allocation process with industry and NERSA. Government indicated that the process for new entrants is expected to be made public during the second quarter of the current financial year. For the logistics and fuel sectors the significance lies in whether implementation can expand participation without weakening fuel security or terminal efficiency. The practical effect will only become clear once the entry requirements, capacity allocation rules and operating arrangements are published.
Source: Adapted from Freight News
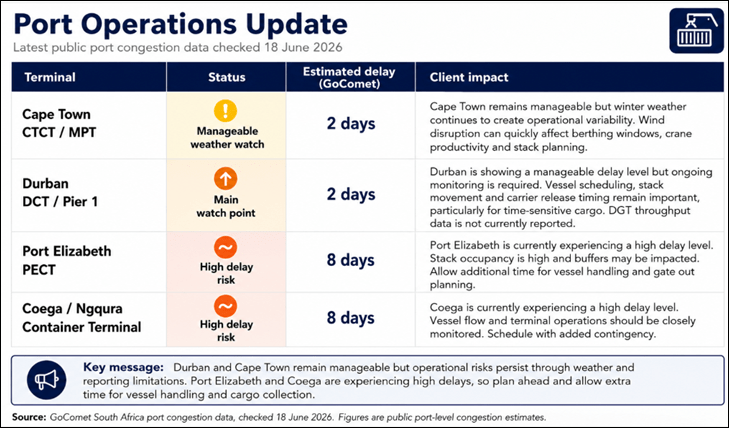
Port Operations Update:
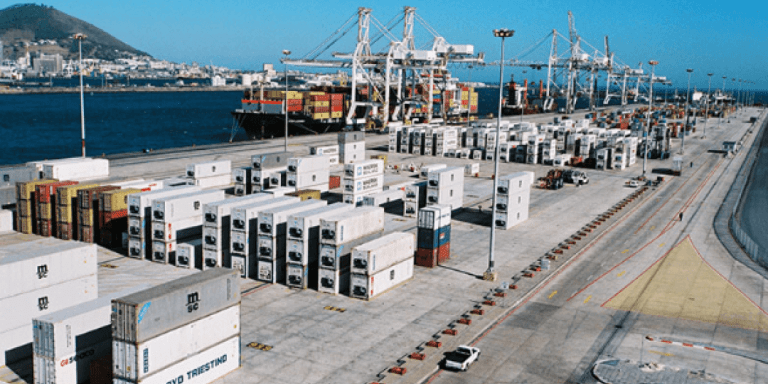
South African port operations remained active during the latest reporting period, but current congestion and terminal performance differed across the main ports. GoComet currently reports estimated delays of two days at Durban and Cape Town and eight days at Port Elizabeth and Coega.
- Durban: GoComet reports an estimated port delay of two days. On 18 June, the wider port had 16 vessels at anchorage and 28 vessels at berth across all vessel categories. Durban Container Terminal Pier 1 handled 1 209 containers against a 2025 daily average of 1 327, with four of seven cranes operational and truck turnaround recorded at 53 minutes. Durban Gateway Terminal had one vessel at anchorage and four at berth, but formal container throughput remained unavailable.
- Cape Town: GoComet reports an estimated delay of two days. Cape Town Container Terminal handled 2 012 containers against a daily average of 1 202, with all nine cranes operational. Strong winds continued restricting operations, which means the two-day delay position could change quickly when weather affects vessel and crane activity.
- Coega and Ngqura: GoComet reports an estimated delay of eight days for Coega. The Ngqura Container Terminal handled 1 488 TEUs against a daily average of 2 008, with seven of eight cranes operational and truck turnaround recorded at 28 minutes. Three container vessels were reported drifting outside the port, which supports the need for closer vessel specific monitoring.
- Port Elizabeth: GoComet reports an estimated delay of eight days. The container terminal handled 578 TEUs against a daily average of 431, with two of three cranes operational. Truck turnaround was recorded at 33 minutes while stack occupancy remained high at 71% for general cargo and 74% for reefer cargo.
The practical message is that Durban and Cape Town currently appear manageable on GoComet’s congestion measure, but both still carry operational risks through reporting limitations and weather. The larger current delay risk is in the Eastern Cape, where Port Elizabeth and Coega are both showing approximately eight days.
What to monitor: Eastern Cape vessel delays together with Cape Town wind conditions and the continued lack of formal throughput reporting from Durban Gateway Terminal.
Key Highlights from Last Week’s Discussions – 14 June 2026
Source: BUSA, SAAFF, and global logistics data
Port Operations
South African container terminals handled 61 252 TEUs during the week of 8 to 14 June, an increase of 6% from 57 965 TEUs in the previous period. The daily average increased to 8 750 TEUs and exceeded the projected average of 7 809 TEUs. Ngqura recorded the strongest weekly improvement, increasing by 35% to 19 408 TEUs while Port Elizabeth increased by 29% to 5 307 TEUs. Cape Town remained broadly stable at 14 813 TEUs while Durban Pier 1 declined by 2% to 15 308 TEUs. Formal throughput data for Durban Gateway Terminal remains unavailable following the transition from DCT.
Key Insight: Port throughput improved overall but the recovery was uneven, with strong Eastern Cape performance offset by limited Durban Gateway Terminal visibility and continued weather exposure in Cape Town.
Air Cargo
International air cargo through OR Tambo increased by 9% week on week to 6 971 tonnes. Inbound cargo increased by 16% to approximately 4 458 tonnes while outbound cargo declined by 3% to approximately 2 513 tonnes. Current OR Tambo volumes were 11% higher than June 2025 and 10% above June 2019 levels. Global air cargo rates eased by 1% to US$3.24 per kilogram but remained 33% higher year on year.
Key Insight: Air cargo volumes recovered but pricing remains elevated, particularly where capacity is constrained or shipments are time sensitive.
Road and Border Crossings
Average South African border crossing times improved to approximately 8.2 hours, down 16% from the previous week. Average SADC crossing times also improved to approximately 7.1 hours, down 11%.
Conditions were not consistent across all corridors. Lebombo truck volumes declined by 3% to approximately 1 445 heavy vehicles per day while queue times increased by 24% to 4.7 hours and processing times increased by 26% to 4.4 hours. Kasumbalesa remained the most constrained crossing, with transit from the Zambian side taking approximately four and a half days. Total indirect cross-border delay costs increased by 22% to an estimated R704 million.
Key Insight: Average crossing times improved but the financial cost of delays increased, showing that corridor specific congestion remains more important than the overall regional average.
Ocean Freight and Global Shipping
Global container freight rates continued to increase, with Drewry’s World Container Index rising by 12% to US$3 969 per 40-foot container, its highest level in 18 months. Rates increased across the Transpacific and Asia to Europe trades as cargo was brought forward and carriers maintained tight capacity management. The reported reopening of the Strait of Hormuz reduced immediate supply chain risk, but carriers are expected to restore Gulf services cautiously while retaining contingency routes, selective bookings, and war risk surcharges.
Key Insight: Shipping conditions are improving operationally in some areas, but freight rates and geopolitical risk remain material cost drivers.
Strategic Outlook
The week showed stronger container and air cargo volumes together with improved average border crossing times, although execution risk remains uneven. Durban reporting gaps, Cape Town weather exposure, corridor congestion, and elevated freight rates mean businesses should continue checking each shipment against current operational conditions rather than relying on broad market averages.
Global Freight Rates
Drewry’s World Container Index increased by 12% to US$3 969 per 40-foot container on 18 June, reaching its highest level in 18 months. This followed a 3% increase to US$3 549 the previous week and means the index has risen by approximately 16% over the two latest reporting periods. The increase was driven mainly by stronger rates on the Transpacific and Asia to Europe trades.
On the Transpacific route, Shanghai to New York increased by 15% to US$6 769 per 40-foot container while Shanghai to Los Angeles rose by 10% to US$5 142. Cargo being moved earlier ahead of expected United States tariff changes together with carrier capacity management and blank sailings continued to support higher pricing.
Rates from Asia to Europe also strengthened. Shanghai to Rotterdam increased by 15% to US$4 342 per 40-foot container while Shanghai to Genoa rose by 12% to US$5 756. Peak season demand, tighter capacity, higher freight rates and additional peak season surcharges are maintaining pressure across the main east west routes.
The latest movement confirms that freight rates remain volatile and that earlier pricing should not be assumed to remain available. Importers should verify rate validity, carrier space, surcharge exposure and booking deadlines before confirming landed costs or delivery commitments.
What to monitor: Whether carriers maintain the latest rate increases as additional capacity enters the market and peak season bookings progress.
Final Thoughts
his week’s update shows that stronger cargo volumes do not necessarily mean that the logistics environment is stable. Port throughput and air cargo improved but border delay costs increased, freight rates moved higher and new customs measures created additional landed cost risk for affected importers. The focus should remain on controlling each shipment before it moves. Current freight rates, tariff classification, customs duty exposure, supplier documents, port conditions, and delivery requirements should all be confirmed before purchase prices or customer delivery dates are committed.
The wider market remains operational, but conditions can change quickly. Businesses that work from current information and check the detail early will be better placed to protect margin, manage cash flow, and avoid preventable delays.
Operational: Confirm port conditions, carrier schedules, and transport arrangements before committing delivery dates.
Legal and regulatory: Check whether recent safeguard duties, anti-dumping duties or rebate changes affect your products.
Market and cost: Reconfirm freight validity, available capacity, and surcharge exposure before finalising landed costs.
Disclaimer:The information provided in this newsletter is based on reliable sources and has been carefully verified. This Logistics News is distributed free of charge. If you wish to unsubscribe from our mailing list, please reply to this email with “unsubscribe” in the subject line. Please note that all content is adapted or directly quoted from its original sources. We take no responsibility for any inaccurate reporting; we are only adapting the news for you.
This week’s news was brought to you by:
FNB First Trade™ 360 — your partner in logistics and Exporters Western Cape