Welcome to another Logistics News Update.
The logistics environment is still moving but it is becoming more expensive, less predictable, and less forgiving. Freight rates jumped sharply again this week, severe weather affected key agricultural regions in the Eastern and Western Cape.
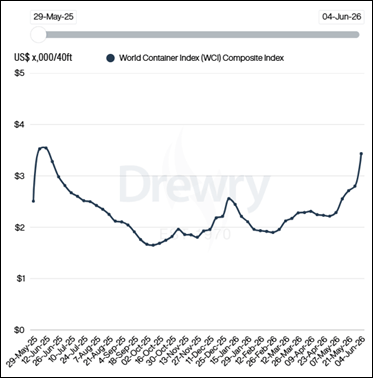
The latest Drewry World Container Index increased by 23% to US$3,433 per 40ft container, driven by stronger demand on the Transpacific and Asia-Europe trades. This is a clear reminder that rate stability cannot be assumed, even though this is international, we see the same with South Africa. Importers and exporters should be checking validity periods, booking windows and routing options before committing to landed costs or delivery promises. Shipping lines can change at a whim, make sure you book in advance and not wait till the last minute.
Recent weather events have also shown how quickly infrastructure, transport planning and export execution can be affected when conditions change. For agricultural exporters, the risk is not only the weather itself but the knock-on effect on roads, packing, cold chain planning, port access, and vessel timing. Locally, port operations remain functional, but performance is uneven. Durban is the main watch point from a congestion perspective while Cape Town remains exposed to winter weather disruption. Cross-border delays also increased this week, with indirect delay costs rising to approximately R591 million as congestion and system constraints continue affecting regional corridors.
The common thread across this week’s update is simple: businesses that plan ahead, check the detail and build flexibility into their supply chains are in a better position to protect margin, delivery commitments, and client relationships. Whether the risk is freight rates, weather disruption, customs documentation, border delays or export competitiveness, the cost of reacting late is usually far higher than the cost of planning properly.
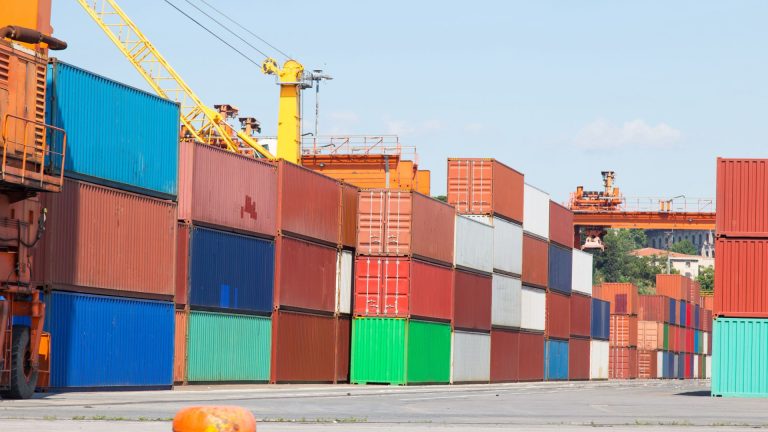
Agri & Transport Summary
South Africa’s citrus export season is gaining momentum but the main focus this week is weather-related disruption. Heavy rain and flooding have affected parts of the Eastern Cape and Western Cape with citrus-producing areas still assessing damage to farms, infrastructure, and access routes. The Eastern Cape appears to be one of the key affected regions, particularly around the Gamtoos River Valley near Patensie. Reports indicate that heavy rain caused the Kouga Dam to rise sharply and the Gamtoos River to burst its banks. In the Western Cape, citrus areas including Citrusdal and Boland also experienced heavy rainfall.
For exporters, the issue is not only crop damage. Road access, inland movement, cold chain handovers, and timing into port can all be affected when weather disrupts farm operations and transport routes. This becomes more important as citrus volumes continue building through the season. The practical message for farmers and exporters is to plan around disruption rather than assume normal flow. Transport bookings, road access, packing schedules and documentation should be checked early because weather-related delays can quickly create cost, quality, and delivery risk.
Logistics & Trade Headlines
- China tariff certificate process is now live: South African exporters can now apply for certificates of origin for qualifying exports to China under the zero-tariff preference scheme. Exporters should still check rules of origin and supporting documents before relying on the benefit commercially.
- Steel tariff protections have widened: Broader steel tariff measures caught some importers by surprise this week. Importers of steel-related products should recheck tariff exposure before confirming landed cost or committing to pricing.
- Fuel import risk remains a strategic concern: Industry commentary this week highlighted that South Africa could reduce exposure to imported fuel risk. For logistics users the practical issue remains fuel volatility and its effect on road freight, airfreight, and inland transport cost.
- Crime and regulation continue to pressure road freight: Road freight operators remain under pressure from crime, compliance, and operating-cost risks. Cargo owners should keep route risk, tracking, driver control, and handover discipline in their transport planning.
- Hormuz transit risk remains under review: Operators are still weighing the risk of moving through the Strait of Hormuz. This remains a global risk point for insurance, fuel pricing, and carrier routing decisions rather than a direct South African port disruption.
- Freight rates have moved sharply higher: Drewry’s World Container Index surged 23% to US$3,433 per 40ft container on 4 June, driven by increases on the Transpacific and Asia-Europe trades as peak season started earlier than normal.
- Cape Town port equipment investment is moving forward: TNPA is moving to procure 10 new cranes for Cape Town. This is positive for future terminal capacity but will not solve short-term weather or operational disruption risk immediately.
Let’s Learn, why supplier documents must match clearing documents
Many importers assume that once the supplier has issued the commercial documents the hard work is done. In reality, one of the most common causes of customs delays is when the supplier’s documents do not match the information submitted for customs clearance.
In practical terms:
Customs authorities use the commercial invoice, packing list, bill of lading and customs entry to verify what is being imported. If the information differs between these documents, it can trigger queries, inspections, delays, or additional requests for supporting information.
Where people get caught:
•Different product descriptions appearing on the invoice and customs entry
• Incorrect quantities, weights, or values on the packing list
• Tariff codes not matching the goods described on supplier documents
• Consignee details differing between the bill of lading and commercial invoice
• Missing certificates, permits or supporting compliance documents
• Changes made after shipment without updating all related documents
Quick example:
A supplier may describe goods as “machine parts” on the commercial invoice while the customs entry reflects a more detailed product description and tariff code. Even if the goods are correct the inconsistency can result in customs queries, inspection delays, and additional storage costs while the information is verified.
Takeaway:
The customs process relies on consistency. Before cargo ships importers should ensure that the commercial invoice, packing list, bill of lading and any compliance documents all tell the same story. Small document differences often create bigger delays than people expect and can quickly lead to avoidable cost and frustration.
NEWS
Steenhuisen calls for ‘practical partnerships’ to boost exports

Agriculture Minister John Steenhuisen has called for stronger public-private partnerships to support export growth and fix the structural issues holding the sector back. Speaking at the Agbiz Congress 2026 Gala Dinner in Gqeberha, he said government should focus on critical enabling infrastructure and remove blockages that make growth harder for productive sectors.
For agricultural exporters, the message is clear. Logistics inefficiency is not just an operational issue. It acts as a direct cost on exporters and affects competitiveness, market access, and growth. Steenhuisen said efficient ports, rail and freight systems are foundational for an export-driven sector. He also highlighted biosecurity, blended agricultural finance, and digital extension services as areas where government and agribusiness can work together more practically. These are important because agricultural growth depends not only on production but also on market access, compliance, financing, and the ability to move goods reliably.
The practical takeaway is that export growth will depend on execution. South Africa has strong agricultural potential, but logistics, rail, port performance, and biosecurity must improve if exporters are going to protect margins and compete internationally.
– Source: Adapted from FreightNews
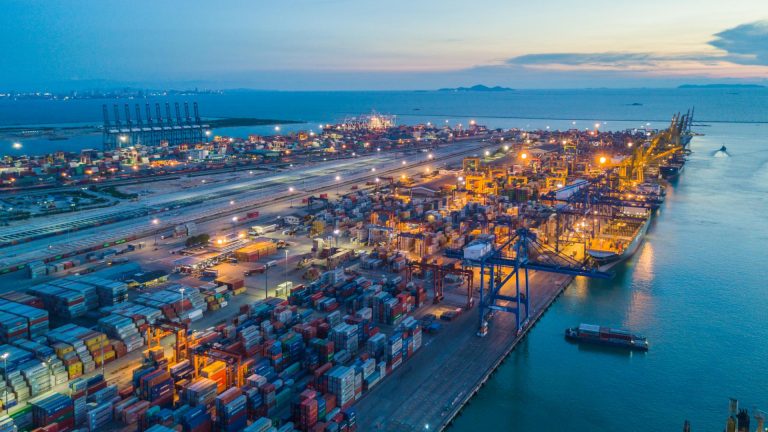
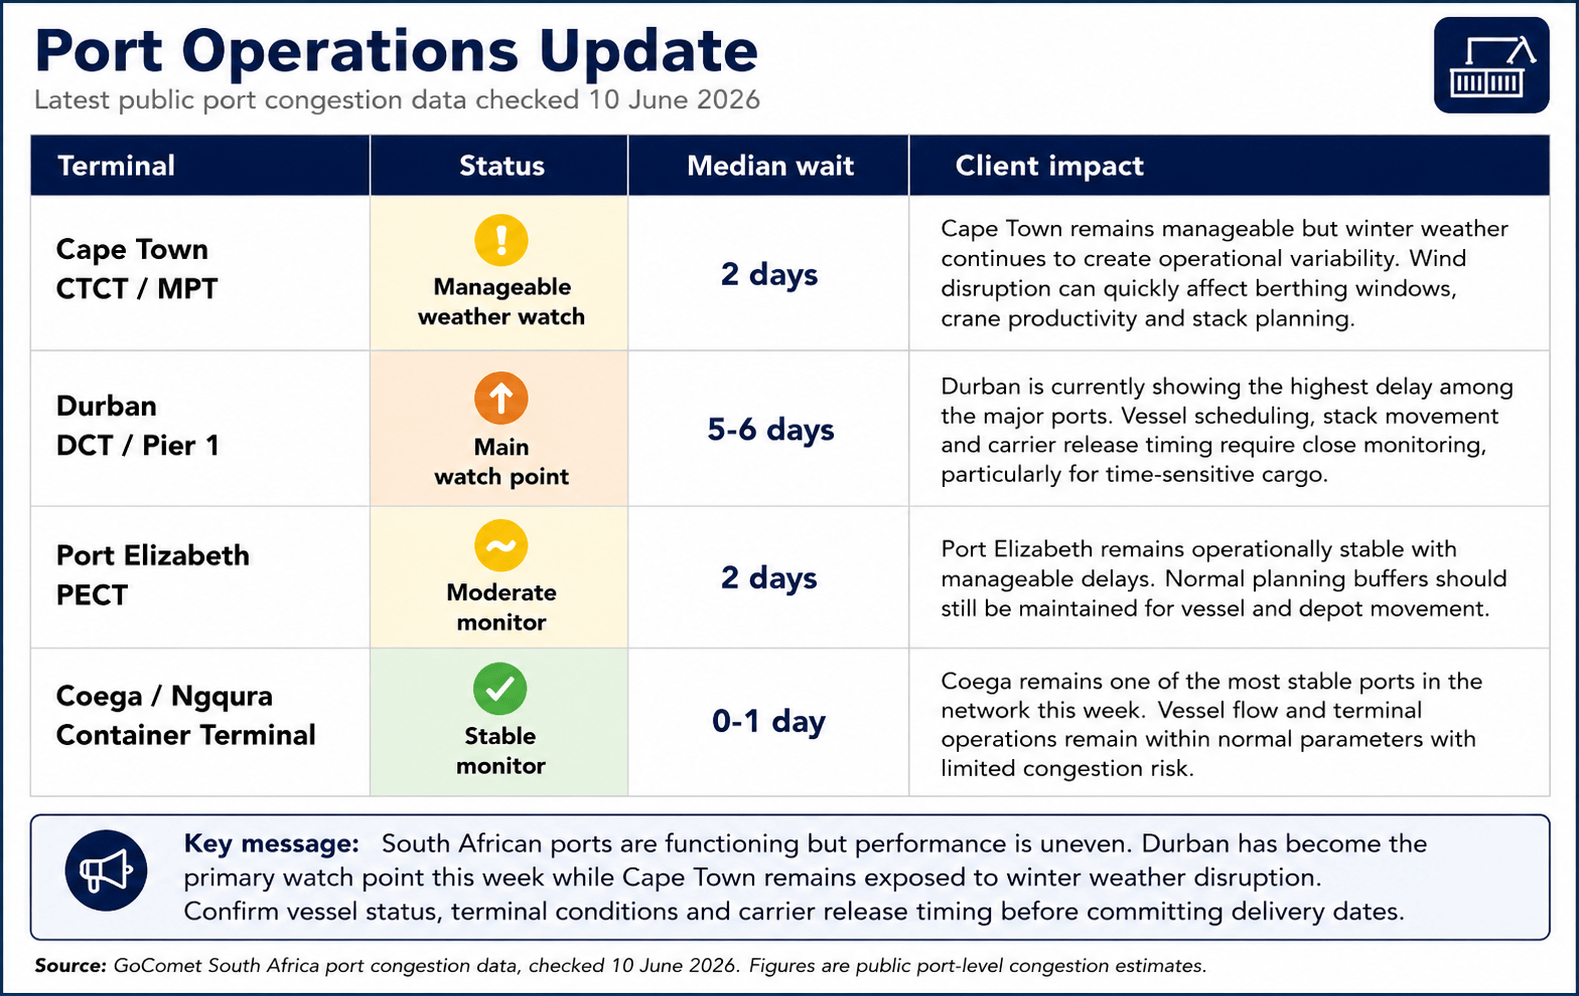
Port Operations Summary: – Port Update:
South African port operations remain manageable but uneven, the latest public congestion data shows Durban as the main watch point with delays reported at more than 5 days. Cape Town remains around 2 days while Port Elizabeth is also around 2 days. Current public data does not give me a clear separate Coega figure that I can confirm this week.
- Durban needs closer monitoring this week, a delay reading above 5 days is a material planning risk and can affect vessel scheduling, stack movement, carrier release timing, and delivery commitments. Clients moving time-sensitive cargo through Durban should confirm terminal status and carrier release before committing delivery dates.
- Cape Town remains manageable but weather sensitive, recent operational reporting shows Cape Town at around 2 days average vessel waiting time, with strong winds still a factor in planning. This does not point to a major failure, but it does mean vessel windows, crane productivity and collections can shift quickly when weather interrupts operations.
- Port Elizabeth is also showing around 2 days, which is manageable but still enough to affect tight delivery windows. Some carrier reports have shown berthing delays of up to 7 days in certain cases, so clients should not rely only on the port-level average when planning urgent cargo.
The practical message for clients is that the ports are functioning, but Durban has become the key risk point this week. Cape Town and Port Elizabeth remain manageable but still need weather and vessel-by-vessel monitoring. The safest approach is to confirm vessel arrival, berth plan, stack status, and carrier release before finalising delivery commitments.
Key Highlights from Last Week’s Discussions – 31 May 2026
Source: BUSA, SAAFF, and global logistics data
Port Operations
Port throughput softened this week after the exceptionally strong performance reported in the previous period, although overall operations remained stable across the network.
• Total container volumes decreased by approximately 9% week on week to 56,421 TEUs
• An average of 8,060 TEUs was handled per day, down from 8,833 TEUs the previous week
• Cape Town Container Terminal increased by 25% week on week to 18,727 TEUs despite weather disruptions towards the end of the week
• Ngqura Container Terminal decreased by 25% week on week to 14,584 TEUs due to weather-related delays and vessel movement constraints
• Port Elizabeth Container Terminal decreased by 32% week on week to 5,132 TEUs due to weather impacts and equipment breakdowns
• Durban Pier 1 decreased by 9% week on week to 13,693 TEUs although landside operations and truck turnaround times improved due to higher RTG availability
• Durban Gateway Terminal reported an estimated 10% increase in throughput to approximately 36,000 container moves for the week despite limited formal reporting
• Rail cargo out of Durban increased by 2% week on week to 3,014 containers
• Bayhead Road congestion remained under observation although no major disruptions were reported during the week
Key Insight: Port performance remains stable but mixed. Cape Town delivered a strong recovery despite weather challenges while Durban’s landside performance improved. The main concerns remain weather-related disruption in the Eastern Cape and ongoing visibility limitations around Durban Gateway Terminal performance.
Air Cargo
Airfreight volumes declined materially this week following the stronger performance recorded in the previous reporting period.
• Total international air cargo through ORTIA decreased by approximately 13% week on week to 6,434 tons
• Inbound cargo decreased by 5% week on week to approximately 3,931 tons
• Outbound cargo decreased by 22% week on week to approximately 2,503 tons
• Current volumes remain approximately 3% above May 2025 levels but approximately 3% below May 2019 levels
• Global air cargo volumes remained approximately 2% higher year on year despite week-on-week stabilisation
• Global spot rates increased to approximately US$3.75/kg and remain around 50% higher year on year
• MESA airfreight capacity remains approximately 32% below pre-war levels
Key Insight: Airfreight remains expensive despite softer volumes. Capacity constraints and elevated rates continue to support pricing, particularly for urgent and high-value cargo.
Road and Border Crossings
Border performance deteriorated this week with queue times, transit times and indirect delay costs all increasing.
• Average cross-border queue time increased by approximately 0.8 hours to 7.2 hours
• Average cross-border transit time increased by approximately 0.7 hours to 7.1 hours
• South African border crossing times improved to approximately 9.1 hours, down 12% week on week
• SADC regional border crossing times worsened to approximately 6.9 hours, up 17% week on week
• Total indirect border delay costs increased to approximately R591 million, up 21% week on week
• Lebombo truck volumes increased by 4% week on week to approximately 1,615 HGVs per day
• Queue times at Lebombo increased to approximately 3.9 hours while processing times increased to approximately 3.5 hours
• Kasumbalesa remained heavily constrained with reported queues of approximately 18km
• Kazungula reported northbound queues of approximately 12km during the week
Key Insight: Border risk increased this week. The concern is no longer average crossing times alone, but the unpredictability created by corridor congestion, system failures, infrastructure issues and security risks across regional trade routes.
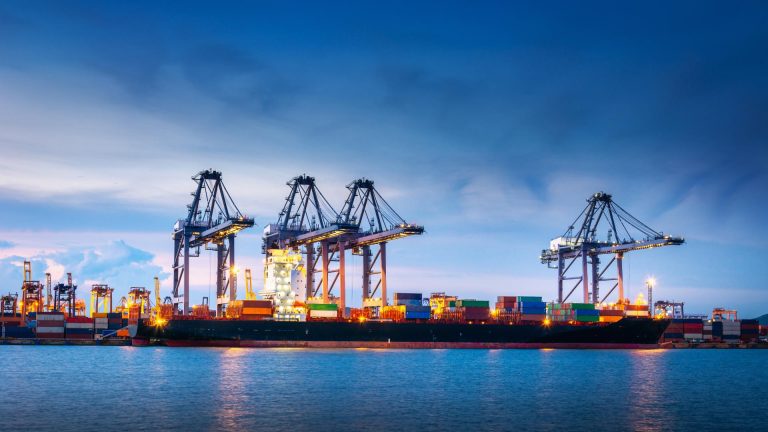
Ocean Freight and Global Shipping
Global shipping conditions remain influenced by geopolitical disruption, improving reliability and continued upward pressure on freight rates.
• Strait of Hormuz remains operational but heavily constrained with selective vessel movements and elevated risk pricing
• UNCTAD estimates that Hormuz-related oil disruption could add approximately US$20 billion annually to vulnerable economies’ import bills
• Suez Canal container transits remain subdued with 46 containerships recorded over the last two weeks, down 15% from the previous fortnight
• Global schedule reliability improved to 62.4% in April, the highest level recorded this year
• Average late vessel arrivals improved to 5.34 days
• Drewry’s World Container Index increased by 3.2% week on week to US$2,811 per 40ft container
• Container equipment availability remains adequate with approximately 1.2 million TEU of new inventory available in China
• Combined carrier EBIT declined sharply to US$1.35 billion in Q1 2026 compared with US$5.47 billion in Q1 2025
Key Insight: The market remains operationally stable, but disruption continues to drive cost pressure. Freight rates, fuel costs, and geopolitical risk remain the primary influences on shipping performance rather than demand growth alone.
Strategic Outlook
This week’s report shows a softer logistics environment than the previous period. Container volumes declined, air cargo volumes weakened and border costs increased. However, port operations remain functional, rail volumes out of Durban improved slightly and schedule reliability continues to recover globally.
The focus remains on execution. Weather-related disruptions, regional border delays, Hormuz uncertainty, and rising freight rates continue to create risk. Businesses should continue planning early, verifying documentation, monitoring vessel schedules, and allowing sufficient flexibility around transport and delivery commitments.
Global Freight Rates
Drewry’s World Container Index surged by 23% this week to US$3,433 per 40ft container, continuing the upward trend as peak season starts earlier than normal. The increase was driven by strong rate movement on both the Transpacific and Asia-Europe trades. Drewry notes that shippers are bringing bookings forward and carriers have successfully implemented higher surcharges and FAK levels.
On the Transpacific trade, rates increased sharply. Shanghai to Los Angeles rose 31% to US$4,565 per 40ft container while Shanghai to New York increased 20% to US$5,505 per 40ft container. Drewry also noted that only three blank sailings were announced for the next week on the Transpacific trade which suggests carriers are expecting stronger cargo volumes. On the Asia-Europe trade, rates also moved higher. Shanghai to Rotterdam increased 25% to US$3,579 per 40ft container while Shanghai to Genoa increased 20% to US$5,089 per 40ft container. Demand is being pulled forward into June ahead of the expected 1 July bunker fuel adjustment and carriers have implemented higher FAKs and peak season surcharges.
The market is now being driven by early peak season demand, continued Red Sea diversions, higher bunker fuel costs, and Middle East geopolitical risk. Drewry also notes that retailers are replenishing inventories earlier than normal ahead of major mid-year sales events which is adding to current demand pressure. Overall, freight rates have moved from firm to sharply higher, importers should not assume that May pricing is still valid. Rate validity, booking windows, carrier space and surcharge exposure must be checked before confirming landed cost or delivery commitments.
Final Thoughts
This week’s message is simple. The logistics environment is still moving but it has become more expensive and less forgiving. Freight rates have jumped sharply, border delays remain unpredictable, port performance is uneven and compliance risk is becoming more practical for importers. For importers and exporters, the focus must now be on control before cargo moves. Rate validity, documentation, tariff exposure, supplier compliance, routing, and delivery timing all need to be checked early. A missed detail can quickly become a cost problem through storage, demurrage, amendment fees or missed delivery commitments.
The latest data shows that stronger volumes do not mean the supply chain is stable. Durban, Cape Town, Coega, regional borders, airfreight capacity and global shipping routes all carry different risks. Each shipment needs to be managed on its own facts and not on a general view of the market. The businesses that protect margin will be the ones that plan early and avoid assumptions. If you are placing orders, moving cargo from China, reviewing landed costs, or committing delivery dates to customers, speak to us before the shipment starts moving.
This week’s news was brought to you by:
FNB First Trade 360 – a digital logistics platform and Exporters Western Cape
Disclaimer:The information provided in this newsletter is based on reliable sources and has been carefully verified. This Logistics News is distributed free of charge. If you wish to unsubscribe from our mailing list, please reply to this email with “unsubscribe” in the subject line. Please note that all content is adapted or directly quoted from its original sources. We take no responsibility for any inaccurate reporting; we are only adapting the news for you.
This week’s news was brought to you by:
FNB First Trade™ 360 — your partner in logistics and Exporters Western Cape