

Welcome to another Logistics News Update.
This week’s update shows a logistics market that is still moving strongly but becoming more sensitive to timing, surcharge exposure, and shipment-level execution.
The headline numbers are positive. South African container terminals handled 103 678 TEUs during the week of 3 to 9 August, up 22% from the previous week and international air cargo through OR Tambo increased to 6 767 tonnes, up 14% week on week. That shows that cargo is moving, but it does not mean that every shipment is moving smoothly or predictably.
The concern this week is that the risk is sitting in the detail. Durban remains a key watch point, Coega and Cape Town require closer monitoring and Durban Gateway Terminal’s NAVIS N4 transition means system access, stack status, bookings, and carrier communication must be checked carefully. At the same time, Drewry’s World Container Index increased again and CMA CGM’s Asia to South Africa surcharge adds another reminder that the base freight rate is not the final landed cost.
For importers and exporters, the practical message is clear. A vessel may be scheduled, a port may be open, and a freight rate may be available, but the shipment is only under control once the carrier, surcharge structure, loading date, terminal position, release, documents, routing, transport plan, and final landed cost have all been confirmed.
This is why cost and service must be managed together, the businesses that manage this market well will be the ones that check earlier, communicate sooner, and avoid committing to delivery dates or customer pricing before the actual shipment facts are confirmed.
Agri & Transport Summary
South Africa’s citrus season remains the main agricultural logistics story, but the tone has shifted. The opportunity is still significant; however, the latest industry position shows a more difficult season than originally expected. The Citrus Growers’ Association has revised its 2026 export estimate down from 209.4 million to 205.3 million 15 kg cartons, with weather damage in the Western and Eastern Cape and continued Middle East disruption placing pressure on volumes, costs, and routing.
The logistics risk remains execution. Citrus still needs to move from farms and packhouses into cold stores, onto trucks, through ports and onto vessels within tight timing windows. When fruit is moving during peak season, any delay in road transport, cold chain handover, terminal access, stack timing, or vessel cut off can quickly become a commercial cost.
Durban remains important because a large portion of export cargo still depends on road movement, cold chain coordination, and reliable port access. Even where national throughput improves, citrus exporters still need to manage the shipment at ground level, from packhouse timing and cold store availability through to truck bookings, port gates, stack opening, and vessel cut off.
The rail picture remains part of the longer-term solution, but it does not remove the immediate pressure from the current season. Citrus exports are still heavily road dependent across key corridors and until practical rail capacity becomes consistent, exporters must continue planning around road execution, port timing, and temperature control.
The cost side remains material. The issue is not only whether fruit can be sold into export markets. The real commercial test is whether the shipment can move reliably, within the required temperature window and at a cost that protects the exporter’s margin. With weather damage, routing uncertainty, port pressure, and carrier surcharge activity all in the market, exporters need to check timing and cost before committing to delivery expectations.
What to monitor: Citrus peak movement, revised export volumes, cold chain timing, truck availability into Durban, port gate performance, vessel cut offs, weather-related disruption and whether export logistics costs remain manageable for growers and exporters.
Logistics & Trade Headlines
- CMA CGM surcharge adds to landed cost pressure: CMA CGM has announced surcharge activity affecting South Africa-related trades, with earlier notices including Peak Season Surcharge updates from China to South Africa and Mozambique, as well as emergency fuel-related surcharges linked to renewed Strait of Hormuz risk. The practical point for importers is that the freight rate on its own is not the final cost. Carrier-specific PSS, emergency fuel charges, routing changes, free time, and validity periods all need to be checked before landed costs are approved.
- Durban Gateway Terminal NAVIS N4 cutover goes live: Durban Gateway Terminal moved ahead with the NAVIS N4 cutover scheduled from 15 August at 18:00, with an estimated 12-hour migration window during which no vessel or landside operations would take place. Existing Transnet NAVIS users are not automatically migrated, so registration and ICTSI RADAR access are now practical issues for cargo visibility and terminal transactions.
- Durban congestion continues to affect carrier planning: Durban Gateway Terminal congestion remains a live operational issue, with Kuehne+Nagel’s reporting that average anchorage at DGT reached 80 hours in July, based on local Freight News reporting. The report also notes that Maersk and CMA CGM removed the next two eastbound Port Louis calls from their Safari service because of continuing delays at Durban Gateway Terminal.
- Drewry WCI increases again to US$4 339 per 40ft: Drewry’s World Container Index increased by 1% to US$4 339 per 40ft container on 13 August, driven by higher Transpacific rates. This means the market is still not easing in a straight line and importers should continue checking rate validity, routing, surcharges, and vessel space before finalising landed costs.
- Blank sailings remain part of carrier capacity discipline: Drewry’s latest Cancelled Sailings Tracker shows 49 blank sailings expected from week 34 to week 38, representing a 7% cancellation rate across major East-West trades. Most cancellations are concentrated on the Transpacific eastbound trade, followed by Asia to North Europe / Mediterranean and the Transatlantic.
- China congestion and Middle East risk keep intra-Asia rates under pressure: Drewry’s Intra-Asia Container Index rose 6% to US$1 028 per 40ft container on 13 August, reaching a six-week high. Drewry linked the move to market tightness caused by Middle East unrest and poor weather conditions that created congestion across China.
- SARS clarifies retrospective certificate of origin rules under China zero tariff treatment: SARS issued a 13 August customs update clarifying retrospective issuance of certificates of origin under the China Zero Non-Reciprocal Tariff Treatment. The update confirms that a certificate may be issued retrospectively within one year from shipment where it was not issued before or at the time of shipment due to valid causes.
- India and SACU revive preferential trade agreement talks: India and the Southern African Customs Union signed terms of reference on 12 August to restart preferential trade agreement talks. The negotiations are relevant for South African importers and exporters because they could affect tariff treatment, sourcing, automotive trade, pharmaceuticals, machinery, electrical equipment, and access to critical minerals over time
What to monitor: Durban Gateway NAVIS N4 stabilisation, carrier service changes linked to Durban delays, Drewry’s next WCI movement, blank sailing exposure, China weather-related congestion, Middle East routing risk, SARS origin documentation requirements, and any progress in India-SACU trade negotiations.
Let’s Learn, why the base freight rate is not the final freight cost
When importers receive a freight rate, it is easy to focus only on the base ocean freight. The problem is that the base freight rate is only one part of the final shipping cost. Carriers can apply additional charges such as Peak Season Surcharges, Emergency Fuel Surcharges, port congestion charges, bunker adjustments, and destination-related charges.
This matters because a shipment can still become more expensive even when the headline market index looks stable or only moves slightly. Drewry’s World Container Index increased by 1% to US$4 339 per 40ft container on 13 August 2026, which shows that the market is no longer easing in a straight line.
In practical terms, a carrier surcharge is an additional charge applied by the shipping line to recover cost, manage capacity or respond to market pressure. For example, CMA CGM has published Peak Season Surcharge notices on China to South Africa-related trades, which shows why South African importers must check carrier-specific charges and not only the general market rate.
Where businesses get caught
• Accepting a base freight rate without checking whether a PSS applies
• Assuming a Drewry movement reflects the actual rate charged by the carrier
• Forgetting that surcharges can differ by carrier, origin, destination, equipment type and loading date
• Approving landed cost before checking validity dates and surcharge applicability
• Not allowing for emergency fuel, routing, or port congestion related charges
• Comparing two rates without checking whether both include the same surcharge structure
Quick example
An importer receives a China to Durban rate and uses that figure to calculate landed cost for the customer. The base rate looks acceptable, but the carrier then applies a Peak Season Surcharge from the loading date. The shipment still moves, but the landed cost no longer matches the approved estimate.
The problem is not only the extra cost. It can affect margin, customer pricing, internal approvals, and cash flow timing. If the surcharge is only picked up after the shipment is booked, the business may have limited room to recover the cost from the customer.
Takeaway
A freight rate should never be approved on the base ocean freight alone. Before confirming landed cost or customer pricing, check the carrier, sailing, loading date, validity period, Peak Season Surcharge, bunker or fuel charge, port congestion charge, routing, free time and whether the rate is all-in or subject to additional charges.
NEWS
CMA CGM surcharge adds to Asia to South Africa cost pressure
Freight News
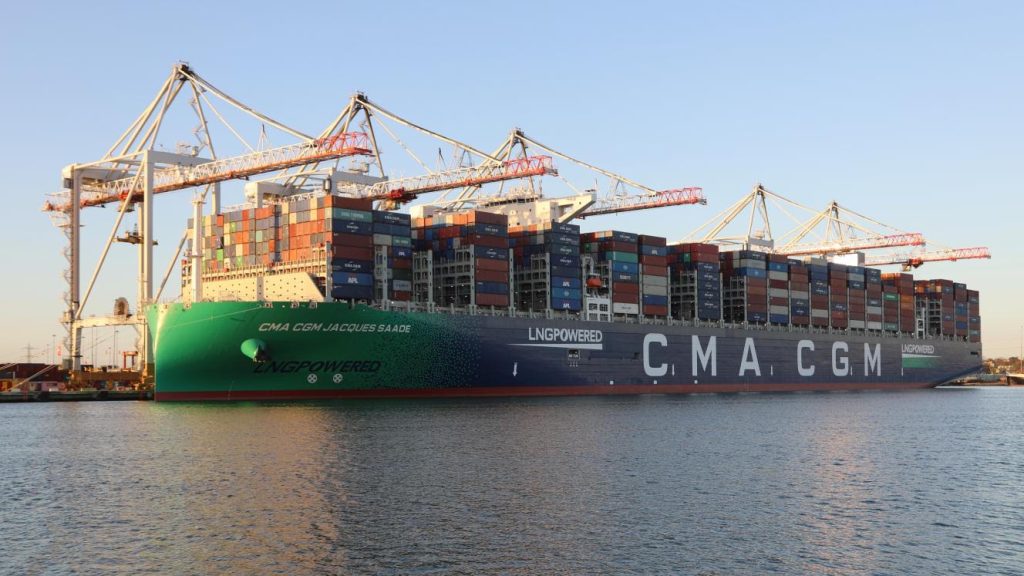
CMA CGM will introduce a US$100 (R1 615) per TEU peak-season surcharge on cargo from Asia to South Africa and Mauritius from August 20. Source: Geni FreightNews
CMA CGM will introduce a US$100 per TEU Peak Season Surcharge on cargo moving from Asia to South Africa and Mauritius from 20 August 2026, based on the loading date. Freight News reported that the surcharge will apply to all cargo and will remain in place until further notice.
This matters because the freight market is no longer easing in a straight line. Drewry’s World Container Index has already started edging upward again and carrier-specific surcharge activity shows why importers cannot rely only on the headline rate when finalising landed costs. A base ocean freight rate may look acceptable, but the actual cost can change once Peak Season Surcharges, bunker-related charges, terminal handling charges, safety and security surcharges, contingency charges and local charges are applied.
For South African importers, the commercial risk is simple. If a shipment is quoted or approved using only the base freight rate, the final landed cost may be understated before the container even moves. On a 40ft container, a US$100 per TEU surcharge effectively becomes US$200 per 40ft container, before any other applicable carrier or local charges are considered. This can affect margin, customer pricing, cash flow planning, and the ability to recover additional cost from the client.
The timing is also important. The surcharge takes effect from 20 August, which means cargo already being planned from Asia needs to be checked against the intended loading date, carrier, routing, and rate validity. Businesses should not assume that a rate received earlier in the month will still be the final payable cost once the shipment is booked and loaded.
The wider message is that logistics cost control is becoming more shipment specific. Market indices are useful, but they do not replace carrier-specific checks. Each shipment should be confirmed against the actual carrier tariff, surcharge structure, sailing, free time, routing and applicable local charges before customer pricing or delivery commitments are finalised.
Source: Adapted from Freight News
What to monitor: CMA CGM surcharge implementation from 20 August, whether other carriers follow with similar adjustments, Drewry’s next WCI movement, Asia to South Africa rate validity, bunker and local charges, routing changes and whether carrier capacity discipline continues into the second half of August.
Port Operations Update:
Durban 5 days
Cape Town 3 days
Coega 4 days
Port Elizabeth 1 day
South African port conditions remain uneven this week, with Durban still a key watch point but Coega and Cape Town now requiring closer attention as well. Current GoComet indicators show Durban at approximately 5 days, Cape Town at approximately 3 days, Coega at approximately 4 days and Port Elizabeth at approximately 1 day. These are general congestion indicators and should not be treated as guaranteed waiting times for every vessel or container.
- Durban: Durban remains the main commercial risk because a 5-day congestion indicator still has a direct effect on vessel planning, container availability, carrier release, and final delivery commitments. Durban Gateway Terminal has also moved through its NAVIS N4 transition period, which means users should continue checking system access, booking visibility, stack status, and carrier communication before promising delivery dates. The practical risk is not only the number of days at port but whether the specific vessel, terminal, stack, and transport plan are aligned.
- Cape Town: Cape Town is currently showing an estimated delay of approximately 3 days, which is higher than last week’s 2-day position. This matters for exporters because Cape Town remains exposed to weather disruption, wind delays and cold chain timing pressure. Citrus and other temperature-sensitive cargo should be planned against actual vessel cut-offs, cold store handovers, stack opening and terminal status rather than relying on the general port indicator alone.
- Coega / Ngqura: Coega is currently showing an estimated delay of approximately 4 days, which is the main change to watch this week. Last week the indicator was approximately 1 day, so this movement needs to be treated seriously. Cargo owners should confirm vessel berthing, stack timing, carrier release, and transport availability before making delivery or onward planning commitments. Where cargo is being routed through the Eastern Cape as an alternative to Durban or Cape Town, the current delay position must be checked before assuming the route is lower risk.
- Port Elizabeth: Port Elizabeth is currently showing an estimated delay of approximately 1 day, which remains the most stable indicator among the four ports. Even so, clients should still check vessel-specific updates, transhipment arrangements, carrier schedules, and terminal readiness before relying on planned dates.
The practical message this week is that port risk is not sitting in one place. Durban remains important but Coega and Cape Town now need more attention than they did last week. A lower national average or a better weekly throughput figure does not automatically mean a shipment will move smoothly. Each shipment still needs to be managed against the specific port, terminal, vessel, stack, carrier release and road transport plan.
What to monitor: Durban Gateway Terminal NAVIS N4 stabilisation, Durban vessel queues, Coega’s 4-day delay indicator, Cape Town weather exposure, vessel cut-offs, stack status, carrier release, truck booking availability and whether port congestion changes carrier routing or delivery commitments. Source: Adapted from GoComet South Africa Port Congestion Data, checked 17 August 2026.
Key Highlights from Last Week’s Discussions – 09 August 2026
Source: BUSA, SAAFF, and global logistics data
Port Operations
South African container terminals handled 103 678 TEUs during the week of 3 to 9 August, an increase of 22% from the previous week’s 84 798 TEUs. The daily average increased to 14 811 TEUs, which was above the projected average of 12 943 TEUs for the week. Performance improved across most major terminals. Durban Gateway Terminal handled 34 824 TEUs, up 8% week on week, while Pier 1 handled 16 217 TEUs, also up 8%. Cape Town Container Terminal improved strongly to 16 025 TEUs, up 40%, Ngqura increased to 20 818 TEUs, up 35% and Port Elizabeth increased sharply to 5 747 TEUs, up 118%.
The improvement in volume is positive but operational pressure has not disappeared. Durban Gateway Terminal still reported elevated vessel turnaround times, with vessels waiting an average of 131 hours at anchorage and 68 hours at berth, although both measures improved from the previous week. DGT also confirmed that the NAVIS N4 cutover would commence on 15 August 2026 at 18:00, with a planned migration period and expected ramp-up period thereafter.
Key Insight: The port system moved significantly more cargo last week, but reliability still needs to be judged at shipment level. Higher throughput is positive; however Durban Gateway Terminal, system access, stack status, carrier release, and vessel-specific planning still need close attention.
Air Cargo
International air cargo through OR Tambo increased strongly, with total weekly volume reaching 6 767 tonnes, up 14% week on week. Inbound cargo increased to 4 237 tonnes, up 13%, while outbound cargo increased to 2 530 tonnes, up 17%. The daily average was approximately 605 000 kg inbound and 361 500 kg outbound. Current OR Tambo volumes are slightly above August 2025 levels by approximately 3% but remain slightly below the pre-pandemic August 2019 level by approximately 2%. Fuel stock levels were reported at 6.5 days for OR Tambo, 4.1 days for Cape Town International and 7.3 days for Durban, all of which were at or above the stated target levels.
Key Insight: Air cargo showed a strong weekly recovery and remains a practical option for urgent cargo, but it should still be costed carefully because international airfreight demand and global rates remain volatile.
Road and Border Crossings
Lebombo truck volumes decreased during the week, with truck movements through the border falling to 1 488 heavy goods vehicles per day, down 9% week on week. Queue times remained broadly stable at approximately 4.5 hours, while average processing time also remained stable at approximately 4.3 hours per crossing. The wider SADC border picture improved. Average cross-border queue time decreased to approximately 6.6 hours, down from about 8.1 hours in the previous report. Average cross-border transit time decreased to approximately 6.5 hours, down from about 7.6 hours. South African-controlled border crossing times improved to approximately 7.7 hours, down 28%, while the wider SADC region improved to approximately 6.3 hours, down 13%. The estimated indirect cross-border delay cost decreased to approximately US$34.6 million, or R562 million, down 24% from the previous week’s estimate of approximately R740 million.
Key Insight: Border performance improved materially last week, especially compared with the previous week’s higher delay cost. However, Beitbridge, Chirundu, Kasumbalesa and Katima Mulilo remained difficult, with Kasumbalesa still taking around three days to cross from the Zambian side.
Rail and Inland Movement
Rail cargo handled out of Durban on the ConCor line increased to 3 232 containers, up from 2 648 containers the previous week. This represents an improvement of approximately 22% week on week.
Key Insight: The improvement in rail movement out of Durban is encouraging, especially in a week where container volumes also increased strongly. The real test is whether this becomes a consistent trend and whether rail can provide practical relief to road-dependent cargo flows over time.
Ocean Freight and Global Shipping
Global container shipping remained resilient in June, with global throughput reaching 17.1 million TEUs. This was down 1.7% month on month but still up 5.5% year on year. Sub-Saharan African exports increased 4.1% month on month and 3.7% year on year, while imports decreased 1.6% month on month but remained 13.3% higher year on year. North Asian port congestion increased sharply after Typhoon Dolphin, with more than 2.4 million TEUs of containership capacity stranded, particularly around Ningbo and Shanghai. Middle East disruption also remained a concern, with only two outbound containership passages recorded through the Strait of Hormuz last week. At the same time, CMA CGM and Maersk returned three additional services to the Suez route via Bab el-Mandeb to help ease vessel and equipment shortages.
Key Insight: Global trade volumes remain stronger than the disruption narrative suggests but congestion, weather, geopolitical risk and vessel availability continue to affect schedule reliability and carrier behaviour.
Global Air Cargo
Global air cargo demand remained positive in July, with worldwide tonnage increasing 2% month on month and 5% year on year. However, China and Hong Kong traffic to Europe softened, with combined volumes to Europe down 9% month on month and 12% year on year. Global spot rates averaged US$3.41 per kg in July, down 8% month on month but still 29% higher year on year. More recent WorldACD data shows worldwide capacity broadly unchanged over the latest two-week period, while chargeable weight and rates both declined by 1%.
Key Insight: Global air cargo remains active but the pricing picture is mixed. Rates have eased from recent highs but remain materially higher than last year, so airfreight decisions still need to be justified by urgency, value and service requirement.
Strategic Outlook
The latest BUSA / SAAFF update shows a better overall week for South African logistics. Container throughput improved strongly, air cargo recovered, rail movement out of Durban increased and cross-border delay costs came down. These are positive signals. The caution is that improved volume does not remove execution risk. Durban Gateway Terminal still requires close monitoring, the NAVIS N4 transition needs to stabilise, North Asian congestion may affect sailing reliability, and carrier behaviour remains sensitive to weather, capacity and geopolitical risk. The practical message for cargo owners is that national averages are useful but not enough. Each shipment still needs to be checked against the specific terminal, carrier, vessel, stack, release, transport plan, border requirement and final landed cost before delivery dates or customer pricing are confirmed.
What to monitor: Durban Gateway Terminal NAVIS N4 stabilisation, vessel anchorage, and berth times, weekly TEU volumes, OR Tambo air cargo recovery, rail movement out of Durban, SADC border delay costs, North Asian port congestion, Middle East routing risk and whether improved volumes translate into more reliable shipment execution.
Global Freight Rates
Drewry’s latest World Container Index increased by 1% to US$4 339 per 40ft container on 13 August 2026, marking the second consecutive weekly increase. Drewry reported that the movement was driven mainly by higher Transpacific rates, while Asia to Europe softened during the same period.
On the Transpacific trade, Shanghai to New York increased 10% to US$8 706 per 40ft, while Shanghai to Los Angeles increased 6% to US$6 244 per 40ft. Drewry noted that carriers are actively restricting space through blank sailings, with cancellations used as part of capacity management. This shows that even where demand is uneven, carriers are still using capacity discipline to support rate levels.
The Asia to Europe trade moved in the opposite direction. Shanghai to Genoa declined 8% to US$5 080 per 40ft, while Shanghai to Rotterdam decreased 5% to US$4 425 per 40ft. Drewry also noted that some carriers have announced new FAK rates on the Asia to Mediterranean trade, but weaker demand raises questions over whether those rate levels can be sustained.
Blank sailings remain an important part of the rate picture. Drewry’s latest Cancelled Sailings Tracker shows 49 blank sailings expected from week 34 to week 38, representing a 7% cancellation rate across the major East West trades. The highest share of cancellations is on the Transpacific eastbound trade, followed by Asia to North Europe / Mediterranean and the Transatlantic.
Intra-Asia rates also strengthened. Drewry’s Intra-Asia Container Index rose 6% to US$1 028 per 40ft, reaching a six-week high. Drewry linked the increase to market tightness caused by Middle East unrest and poor weather conditions, including congestion across China after Typhoon Dolphin. This matters for South African importers because Asia origin movement can still be affected by congestion, feeder disruption, equipment positioning and schedule reliability before the cargo even connects onto the South Africa trade.
The practical message for South African importers is that the freight rate trend cannot be assumed to keep easing. Drewry does not measure South Africa directly, but global rate direction, Asia congestion, carrier blank sailings and surcharge activity all influence the pricing environment. The CMA CGM surcharge we covered this week reinforces the same point: the base ocean freight rate is not the final landed cost.
Before approving customer pricing or landed costs, importers should confirm the carrier, sailing, loading date, rate validity, Peak Season Surcharge, bunker or emergency fuel charge, routing, transhipment plan, free time, and local charges.
What to monitor: Drewry’s next WCI movement, Transpacific rate strength, Asia to Europe softness, CMA CGM surcharge implementation, blank sailing exposure, China port congestion, Middle East routing risk, Panama Canal surcharges and whether carrier capacity discipline continues into late August. Source: Drewrey World
Final Thoughts
This week’s update shows a logistics market that is still moving but becoming more sensitive to timing, surcharge exposure, and operational detail. The headline numbers may look better in places, but the real risk for importers and exporters is still found at shipment level. The main lesson this week is that cost and service cannot be managed separately. A vessel may be scheduled, a port may be open, and a freight rate may be available, but the final outcome depends on the carrier, surcharge structure, loading date, terminal position, system access, documentation, release, and transport plan all lining up at the same time.
The CMA CGM surcharge is a good example of this. A base rate can look acceptable, but once Peak Season Surcharges, bunker charges, routing, free time, and local costs are applied, the landed cost can change quickly. At the same time, port performance remains uneven, with Durban, Cape Town, and Coega all needing vessel-specific checks before delivery dates are confirmed.
For cargo owners, the practical discipline is simple. Do not approve landed costs or promise delivery dates from averages, published schedules or base rates only. Confirm the actual facts of the shipment before committing to the client.
Operational: Check vessel status, terminal position, stack timing, carrier release, and transport availability before promising delivery.
Commercial: Confirm the carrier rate, validity period, Peak Season Surcharge, bunker or emergency fuel charge, routing, free time, and local charges before approving landed cost.
Planning: Build flexibility into timelines, especially where cargo depends on Durban, Cape Town, Coega, Asia-origin sailings, transhipment, or cold chain handovers.
The businesses that manage this market well will not be the ones that react after the delay or surcharge appears. They will be the ones that check earlier, communicate sooner, and protect margin before the shipment moves.
Disclaimer:The information provided in this newsletter is based on reliable sources and has been carefully verified. This Logistics News is distributed free of charge. If you wish to unsubscribe from our mailing list, please reply to this email with “unsubscribe” in the subject line. Please note that all content is adapted or directly quoted from its original sources. We take no responsibility for any inaccurate reporting; we are only adapting the news for you.
This week’s news was brought to you by:
FNB First Trade™ 360 — your partner in logistics and Exporters Western Cape